Here is a self-contained script that shows all steps:
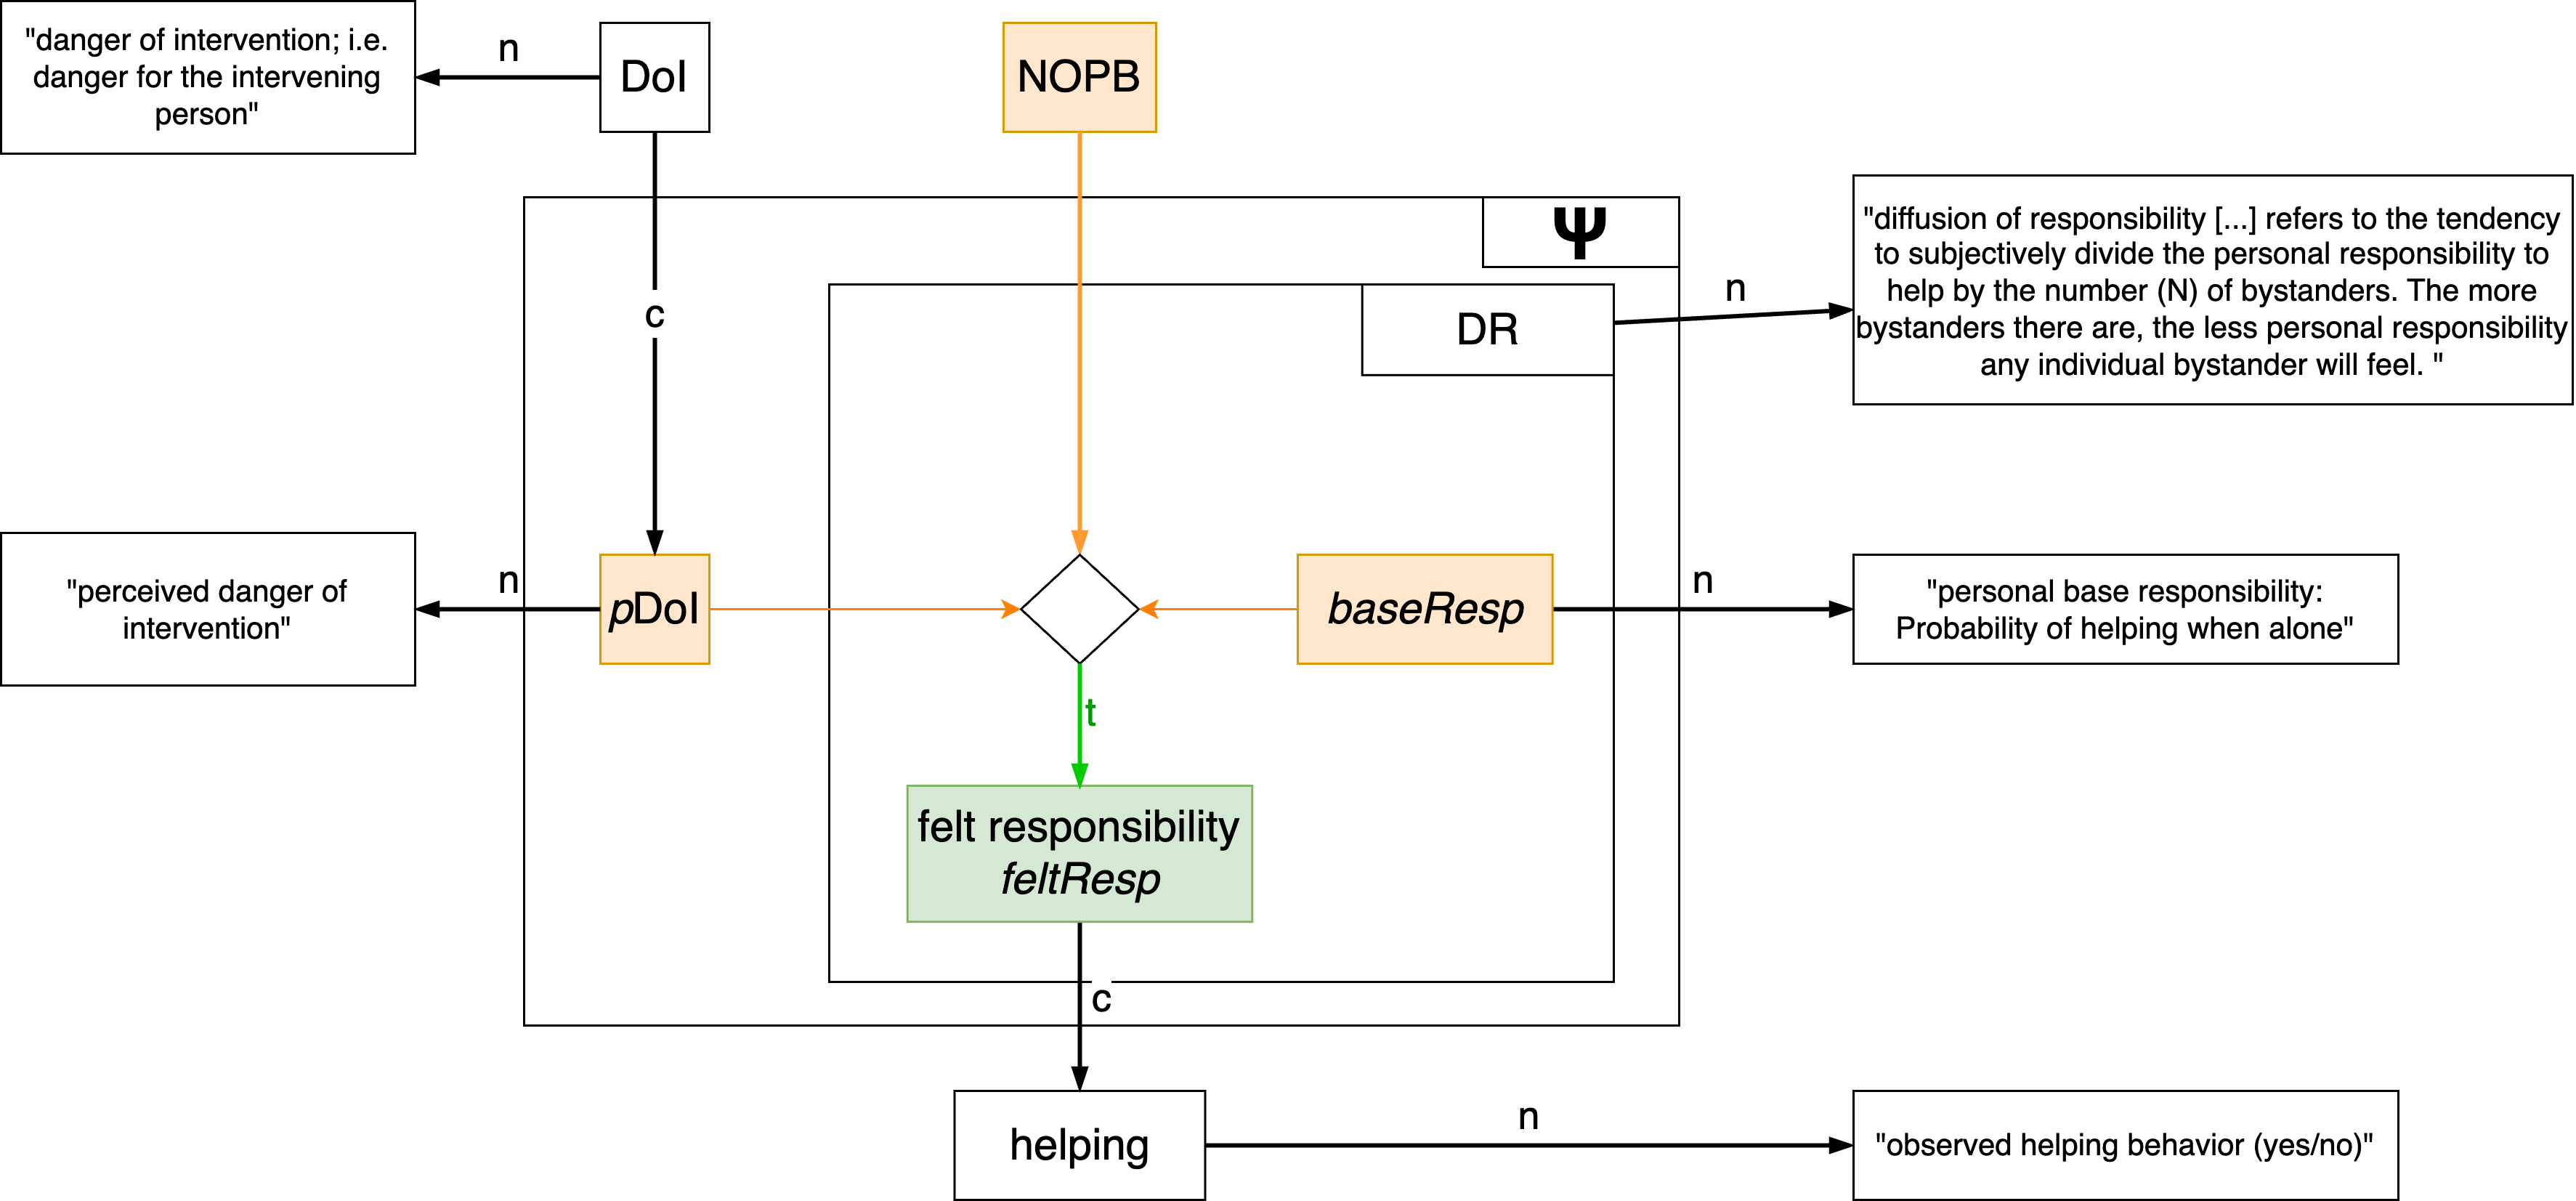
2.1 One possible VAST model
We focus on feltResp as outcome variable.
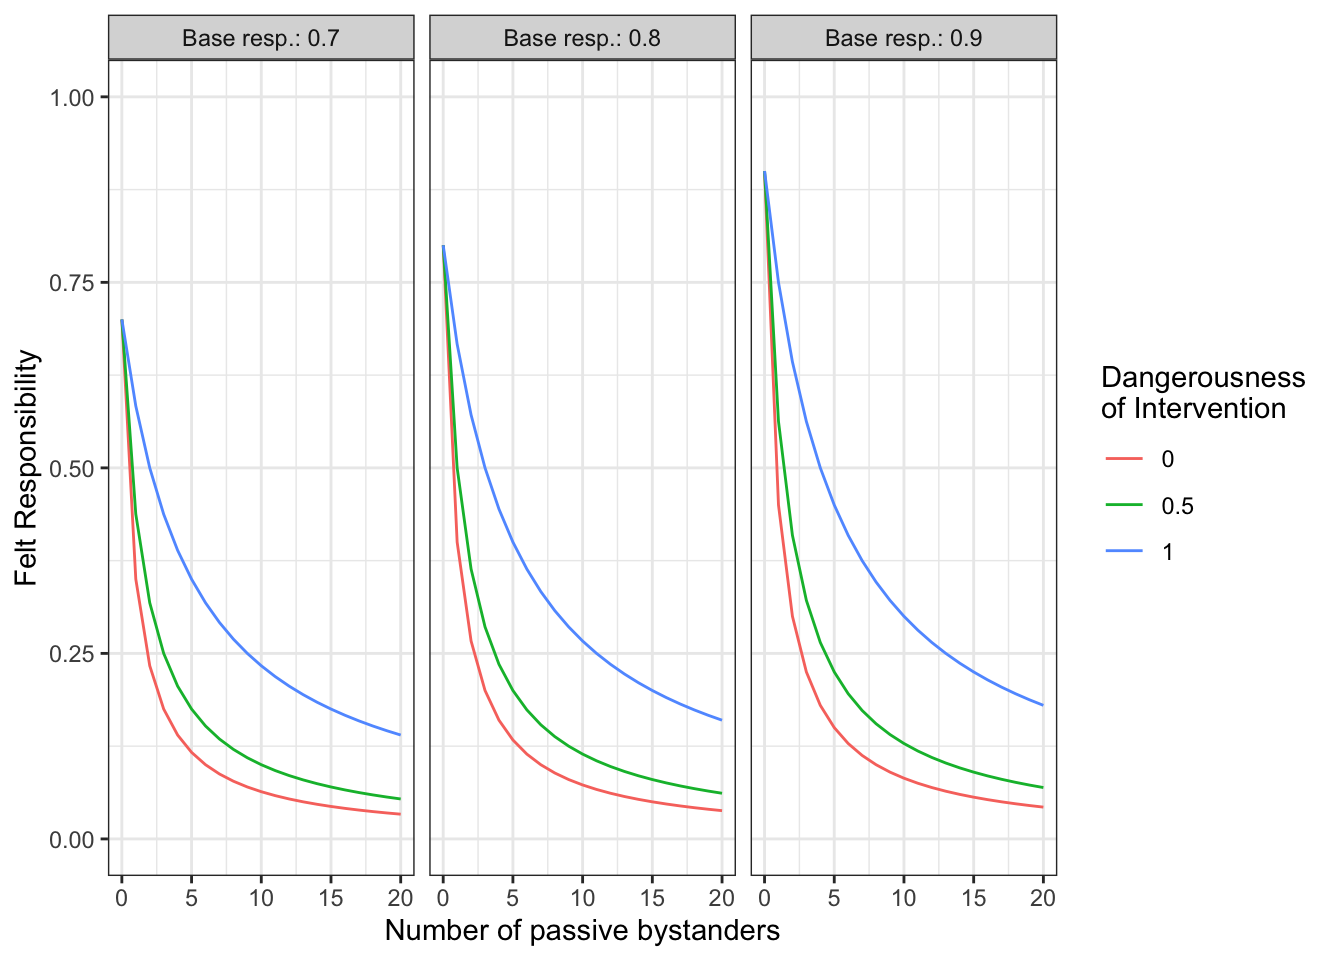
2.2 The code
#---------------------------------------------------------------------# This is one function in my VAST# - It has three input variables: baseResp, NOPB, pDoI# - It has two parameters in the function, which however have been# fixed to the values 0.8 and 0.2.#---------------------------------------------------------------------#' Compute felt responsibility#'#' The base responsibility of "helping when alone" is divided by the#' number of passive bystanders. The strength of the bystander effect#' is modulated by the factor alpha, which is itself a function of#' the perceived danger of intervention. It is an attenuation/boost #' factor for the decline/steepness of the 1/x curve. alpha ranges #' from 0 to Inf, where 0=no bystander effect (BSE), 1=classical BSE #' and values > 1 stronger-than-classical BSEs.#'#' @param baseResp The probability to help when one is alone.#' @param NOPB The number of passive bystanders#' @param pDoI The perceived danger of intervention (ranging from 0..1)#' @return The felt responsibility#'get_feltResp <-function(baseResp, NOPB, pDoI) { alpha <- (0.8- pDoI*0.8)+0.2 feltResp <- baseResp / (alpha*NOPB +1)return(feltResp)}#---------------------------------------------------------------------# Prepare data for plotting#---------------------------------------------------------------------# define the levels that should be plottedplot_data <-expand.grid(baseResp =c(0.7, 0.8, 0.9),NOPB =0:20,pDoI =c(0, 0.5, 1))# nicer labels for facetplot_data$baseResp_label <-paste("Base resp.:", plot_data$baseResp)# compute outcome variableplot_data$feltResp <-get_feltResp(baseResp = plot_data$baseResp,NOPB = plot_data$NOPB,pDoI = plot_data$pDoI)#---------------------------------------------------------------------# Construct the ggplot#---------------------------------------------------------------------library(ggplot2)p1 <-ggplot(plot_data, aes(x=NOPB, y=feltResp, color=factor(pDoI))) +geom_line() +facet_grid(~ baseResp_label) +labs(x="Number of passive bystanders",y="Felt Responsibility",color="Dangerousness \nof Intervention"# \n makes a line break ) +scale_y_continuous(limits=c(0, 1)) +theme_bw()print(p1)
3 Homework (individually)
Read: Van Dongen et al. (2024). Productive explanation: A framework for evaluating explanations in psychological science. Psychological Review. https://doi.org/10.1037/rev0000479 (available in the /literature folder):
Question 1: What is the role an original author should play when predictions are derived from a theory?
Question 2: Are phenomena, according to Bogen and Woodward, directly observable?
Question 3: What are two intermediate processes that are necessary for providing a productive explanation?
Question 4: According to the authors, what are the three steps of productive explanation?
Question 5: What does the paper identify as a limitation of verbal psychological theories compared to formal models in other scientific disciplines?
Question 6: What criteria are suggested for evaluating the quality of explanations in the productive explanation framework?
Question 7: Does Model 3 of the Regulatory Resource Theory explain the ego-depletion effect?
Deliverable: Submit answers to the guiding questions as a plain text/markdown file to the course’s Github repo (go to homework/03-Productive_explanations and upload an .md file with your name as filename). You can answer in English or in German. Most questions can be easily answered in one sentence. Feel free to copy and paste the relevant sentences from the paper.