Session 05 - Mathematical Modeling Part 3
1 Overview
| Topic | Duration | Notes |
|---|---|---|
| Lecture: Intro 2: What is (not) a theory? | 60 | Slides |
| Show consensus VAST model + my implementation | 60 | |
| In groups: Develop extension | 60 |
2 Homework (individually)
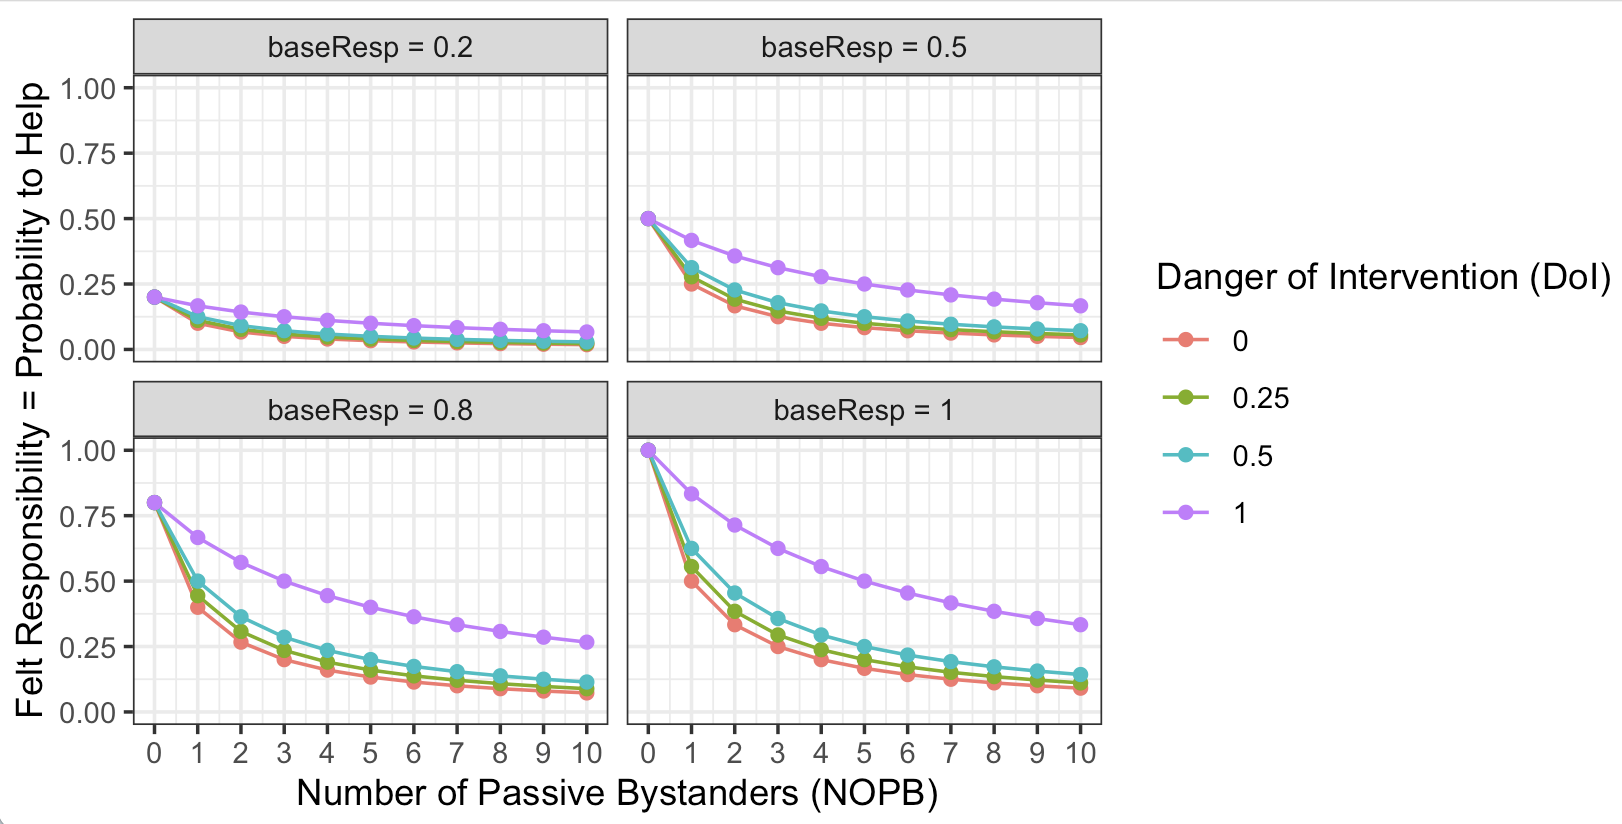
For visualizing our simulation results in the next session, we will use the ggplot2 package in R. One of the most common types of plots we will use is a line plot with multiple groups and eventually multiple facets, like this one:

With such a plot, we can visualize one focal parameter on the x-axis, selected levels of another parameter as colors, and one or two other parameters as sub-plots in the facets. This allows a visualization of a high-dimensional parameter space in a single plot.
If you are not familiar with ggplot2, please do a tutorial as homework. Here are three choices:
- The Data Visualization using ggplot2 tutorial from Datanovia. Do at least the following chapters:
- Chapter 1 (“Introduction to GGPlot2”)
- Chapter 7 (“GGPlot Line Plot”)
- Chapter 14 (“Combine Multiple GGPlots into a Figure”), but only up to section “Multiple panels figure using ggplot facet” (skip the following section “Combine multiple ggplots using ggarrange”)
- The most comprehensive resource is the free online ggplot2 book.
- Start with installing all necessary packages (see Prerequisites).
- Next, read chapter 2 “First Steps”
- Finally, do Chapter 16 “Faceting”
- Data visualization with R and ggplot2 is a quite condensed tutorial on ggplot2 that explains the different layers of a plot with code examples, but not much explaining text.
When you are unsure, I recommend the first resource.
3 Homework Bonus (individually)
For an interactive visualization of your simulation results, you can program a Shiny app in R. Shiny is a web application framework for R, you can find various example for Shiny apps at https://shinyapps.org or https://shiny.posit.co.
Ambitious students can (optionally!) create a Shiny app that allows the user to change parameters of the model interactively and see the results in real-time. For learning Shiny, I recommend the official Shiny tutorial. Although I use various code editors (e.g., Visual Studio Code), I recommend using RStudio because it has a deeply integrated support for building and testing Shiny apps.