

p-curve
(Simonsohn, Nelson, & Simmons, 2014)

Simonsohn, U., Nelson, L. D., & Simmons, J. P. (2014). P-curve: A key to the file-drawer. Journal of Experimental Psychology: General, 143, 534-547.

Simonsohn, U., Nelson, L. D., & Simmons, J. P. (2014). p-Curve and Effect Size: Correcting for Publication Bias Using Only Significant Results. Perspectives on Psychological Science, 9, 666–681.
Simonsohn, U., Simmons, J. P., & Nelson, L. D. (2015). Better P-curves: Making P-curve analysis more robust to errors, fraud, and ambitious P-hacking, a Reply to Ulrich and Miller (2015). Journal of Experimental Psychology: General, 144, 1146–1152. doi:10.1037/xge0000104
The p distribution
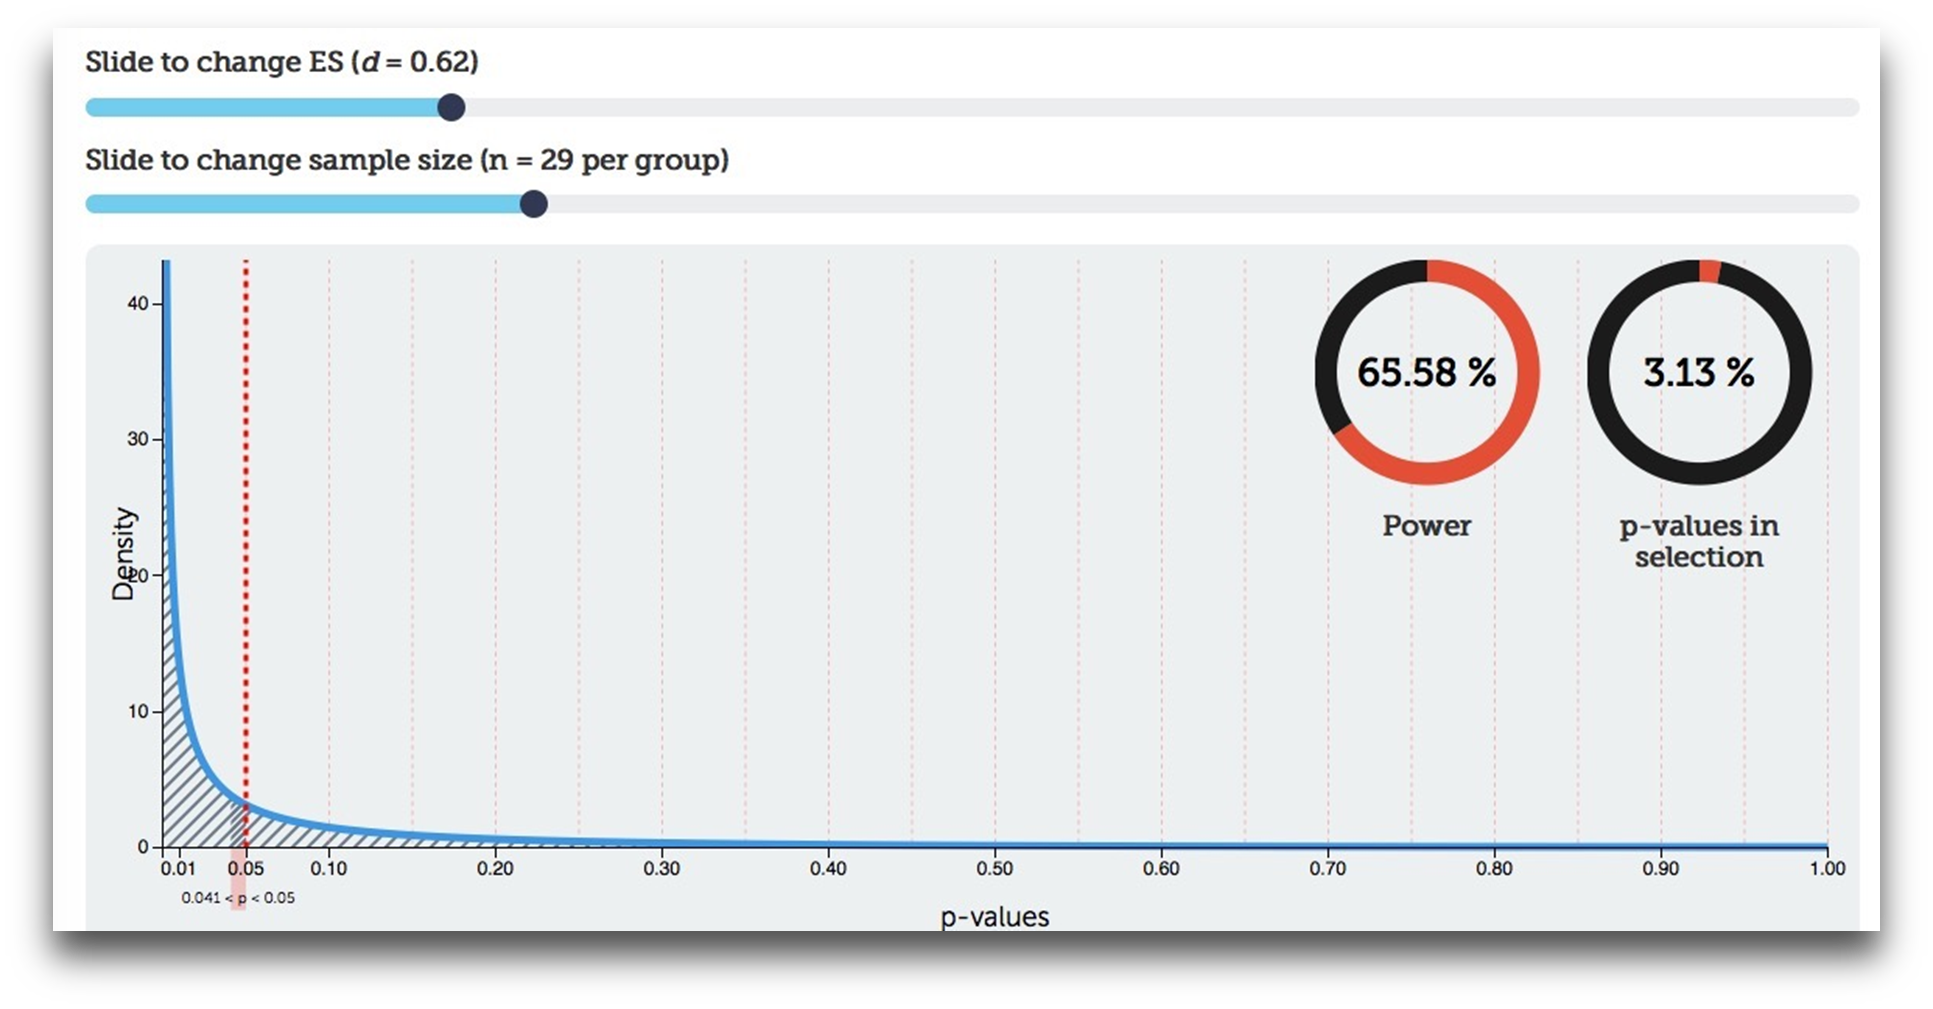
- Given a certain statistical power (or, effect size + sample size), the distribution of p-values has a certain shape.
- Under the H₀, the p-curve is uniformly distributed. That means, each p-value is equally likely.
The p distribution
Null effect
- Running a study without a real effect is like drawing a random p-value from this distribution

The p distribution
Null effect
- Running a study without a real effect is like drawing a random p-value from this distribution
- 5% of all p-values are <5%.

p-curve
Effect size > 0
- With increasing power, the p-curve gets more positively skewed

p-curve
Effect size > 0
- With increasing power, the p-curve gets more positively skewed

p-curve
Effect size > 0
- With increasing power, the p-curve gets more positively skewed


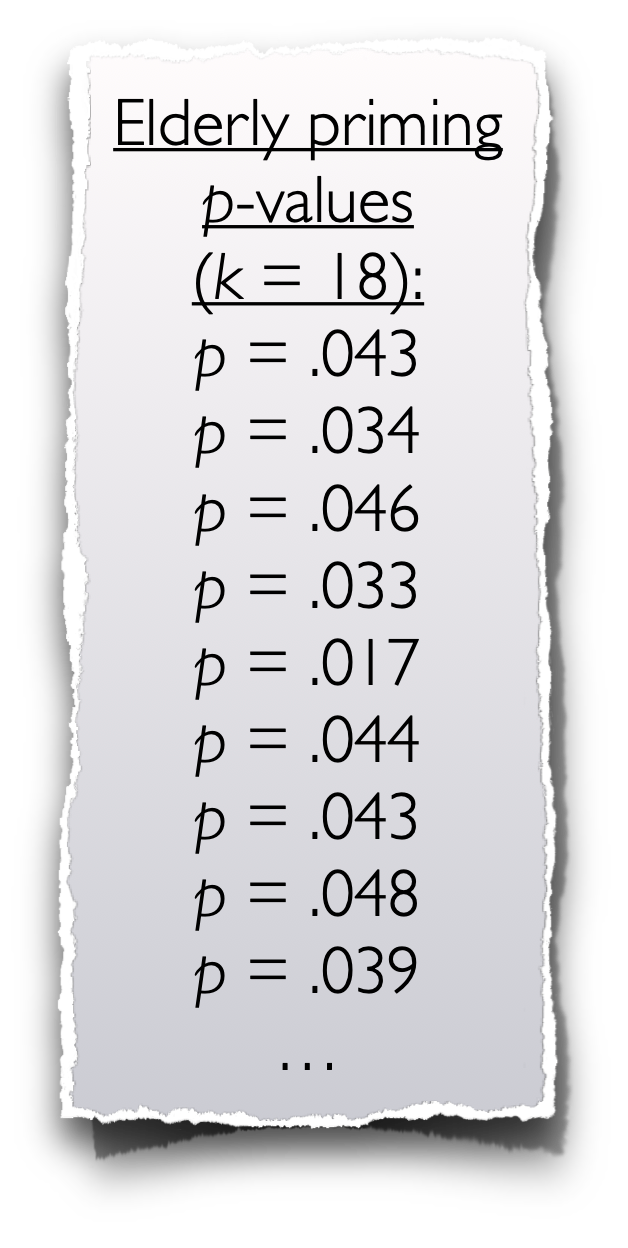
Elderly priming p-values
60% power

Publication bias
- Only results with p < .05 pass the journals’ “significance filter”
- Journals’ selection, or pre-emptive self-selection: “This won’t get published, I don’t even try.”
- Result: Selective & biased picture in the literature

Elderly priming p-values
http://p-curve.com/
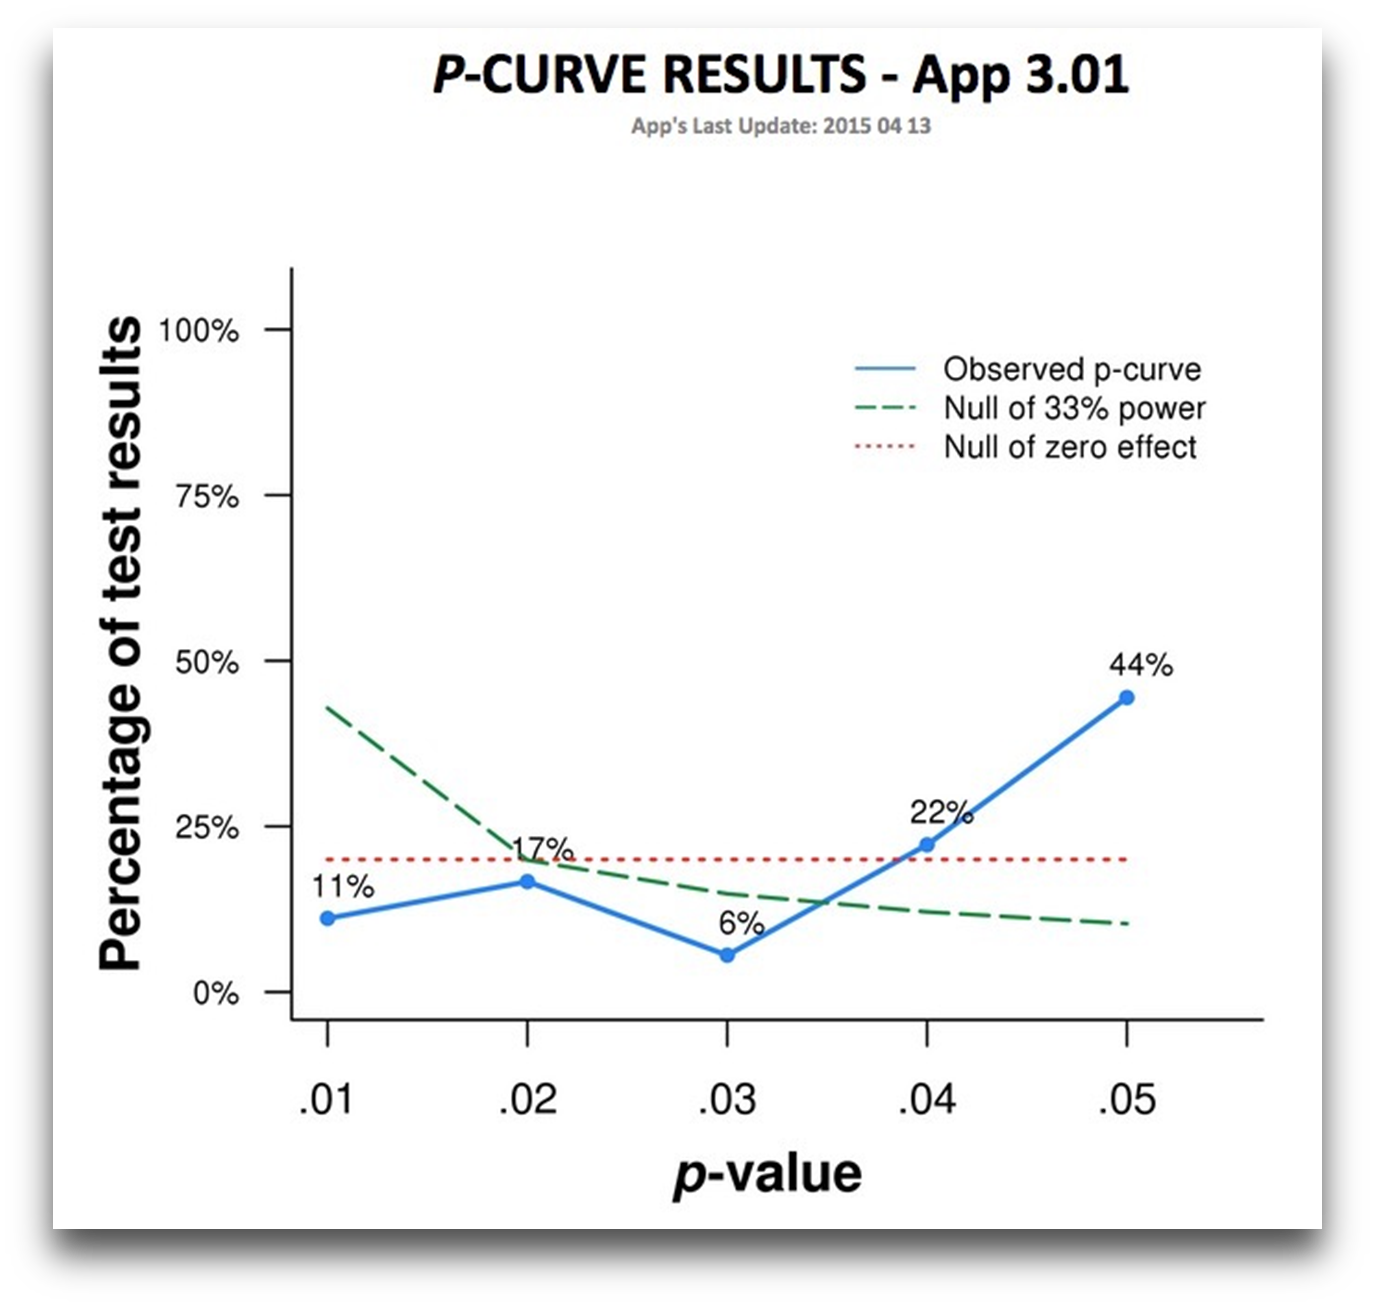

“It may seem that the existence of 33 supportive published studies is enough to conclude that there is an effect of expansive versus contractive posture on psychological outcomes.”
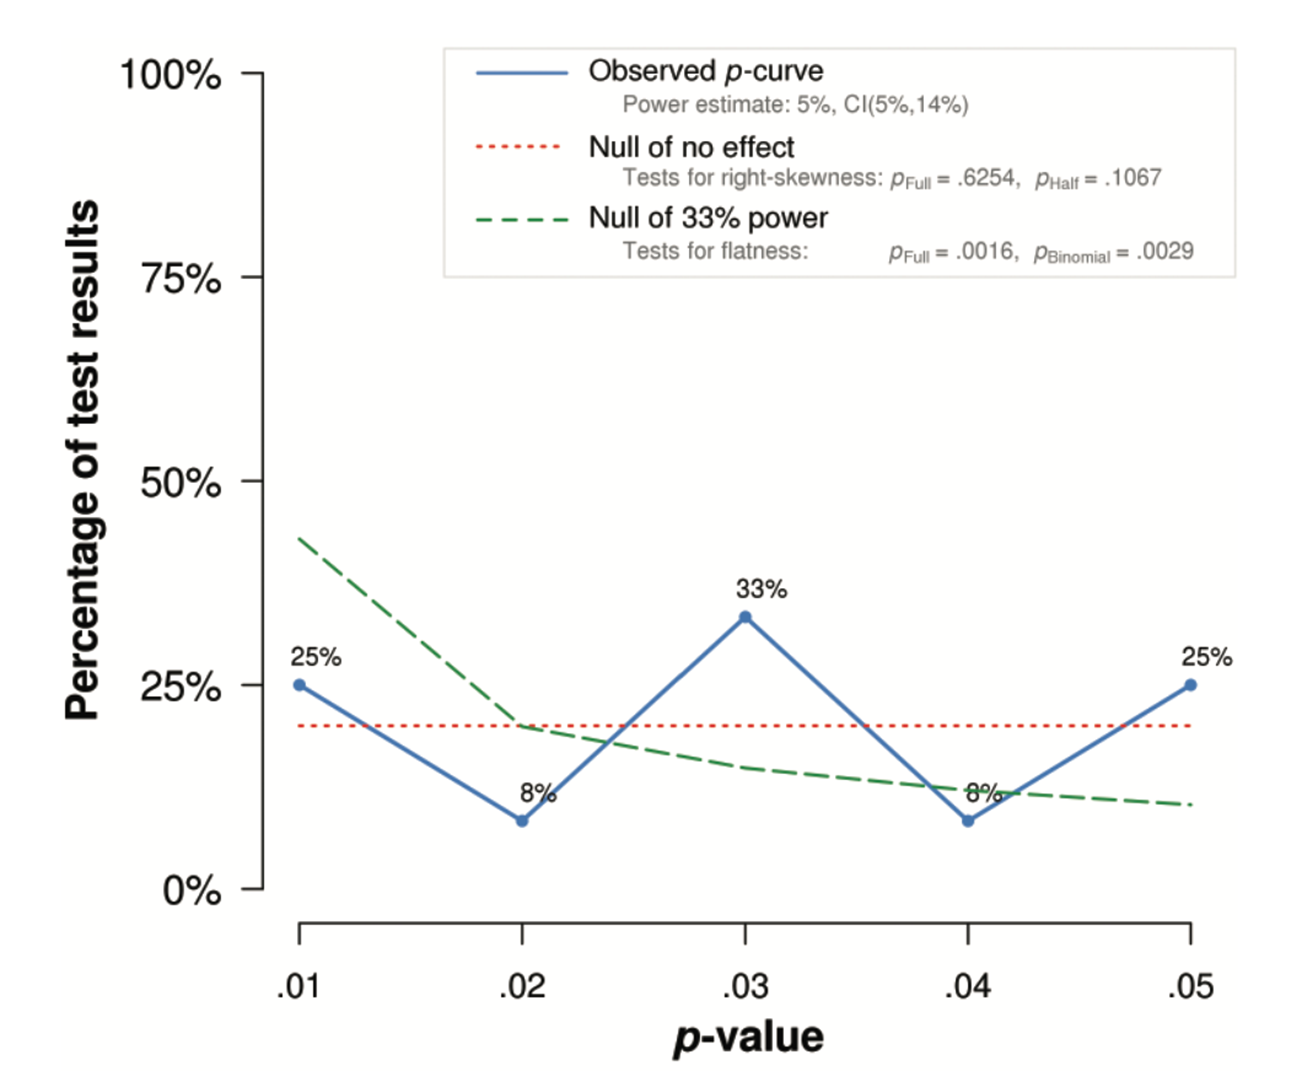
p-curve analysis of 24 significant studies
Evidential value of what?
- The evidential value of the set of studies is examined
- All conclusion from p-curve are about the analyzed set of studies - no inference on single study possible.
- E.g., one can say that a set is probably p-hacked - but not which of these studies has been hacked!
- “A right-skewed p-curve does not imply all studies have evidential value, just as a significant difference across conditions does not imply that all observations were influenced by the manipulation.”
Unit of analysis
- Multiple studies on one effect (ideally, direct replications): What is the evidential value of this effect?
- Multiple studies from one first author: Does person X publish in general studies with evidential value? Or is pure publication bias and/or p-hacking an explanation for this set of studies?
- Compare studies from specific journals, or between research fields: Which journal/ research field publishes a stronger evidential value?
Steps of a p-curve
- Identify researchers’ stated hypothesis and study design
- Identify the statistical result testing the stated hypothesis
- Report the statistical results of interest
- (Recompute the precise p-value(s) based on reported test statistics) ➙ done by the app
- Report robustness results
Which p-values are selected?
- Included p values must meet three criteria:
- test the hypothesis of interest,
- not a manipulation check, etc.
- have a uniform distribution under the null
- this usually has to be assumed
- be statistically independent of other p-values in p-curve.
- Several, correlated DVs: Only take one
- Rule of thumb: Only take one p-value per sample
Disclosure table
- Hacking a p-curve? Easy: only include results that look fishy to you, or drop strong studies
- Goal: Minimize subjectivity
- Define an a-priori inclusion rule
- Do a robustness analysis: Compute p-curve with alternative selection ➙ same results?
- Report all selected test statistics in a disclosure table:
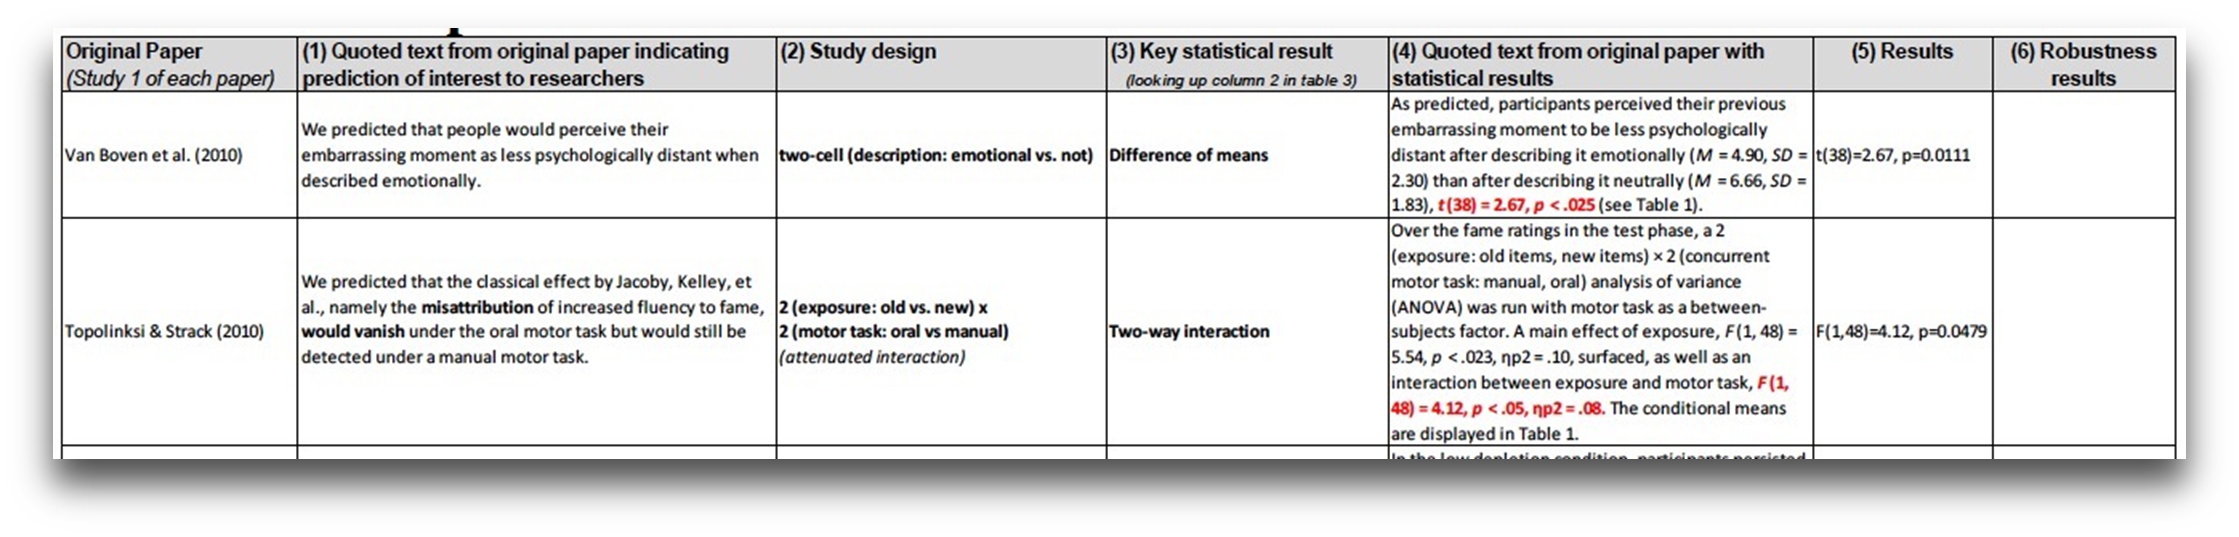
Inclusion rule
- The rule should be set in advanced, before statistical results are analyzed, and disclosed in the paper.
- Examples (from p-curve.com)
- The yearly top-5 most cited articles in the Quarterly Research Journal 1984-1989.
- All studies published in 2009 with wine as a manipulation and simulated driving behavior as a dependent variable.
- The most recent 10 articles published by proctologist Giordano Armani.
- Clinicaltrials.gov registered studies examining antidepressants among teenagers.
- More examples:
- If multiple DVs are reported, always take the first.
- We analyzed the last 20 publications from this research group.
- We analyzed the first hundred papers with more than two studies from the 2008 volume of journal XYZ.
Practical issues
- How many p-values minimum?
- No clear guidelines; tentative suggestion: at least 5; more is better
- Power of p-curve’s statistical tests depends on # of entered p-values
- Beware of strange patterns: Maybe not captured by statistical tests of slope. Visual inspection of p-curve!
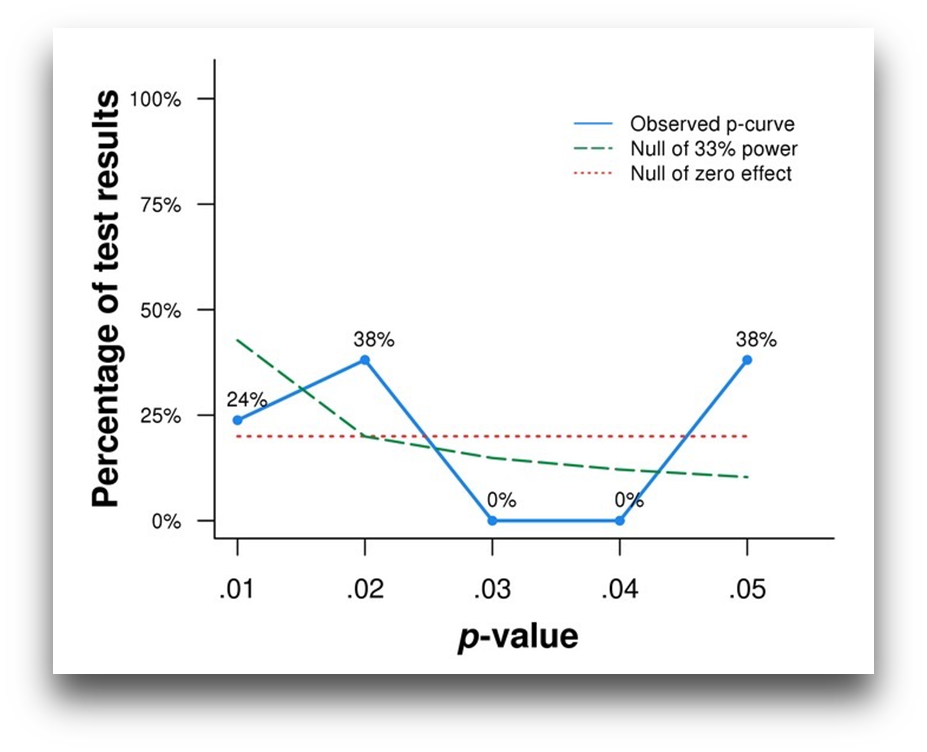
Interactions:
Which p-values to include?
- Attenuation predicted: include only interaction term
- “Always sweat more in summer, but less so when indoors.”
- Reversal of direction predicted: include both simple slopes (but not interaction term)
- “Sweat more in summer than winter when outdoors, but more in winter than in summer when indoors”
Application:
Compare two journals
- Journal of Personality and Social Psychology JPSP (impact factor: 4.736)
- Journal of Applied Social Psychology JASP (impact factor: 1.006)

- Bachelor thesis by Anna Bittner
- 112 resp. 113 hand-coded focal effects from the 2013 issues of both journals (starting in January)
JPSP vs. JASP:
p-curve
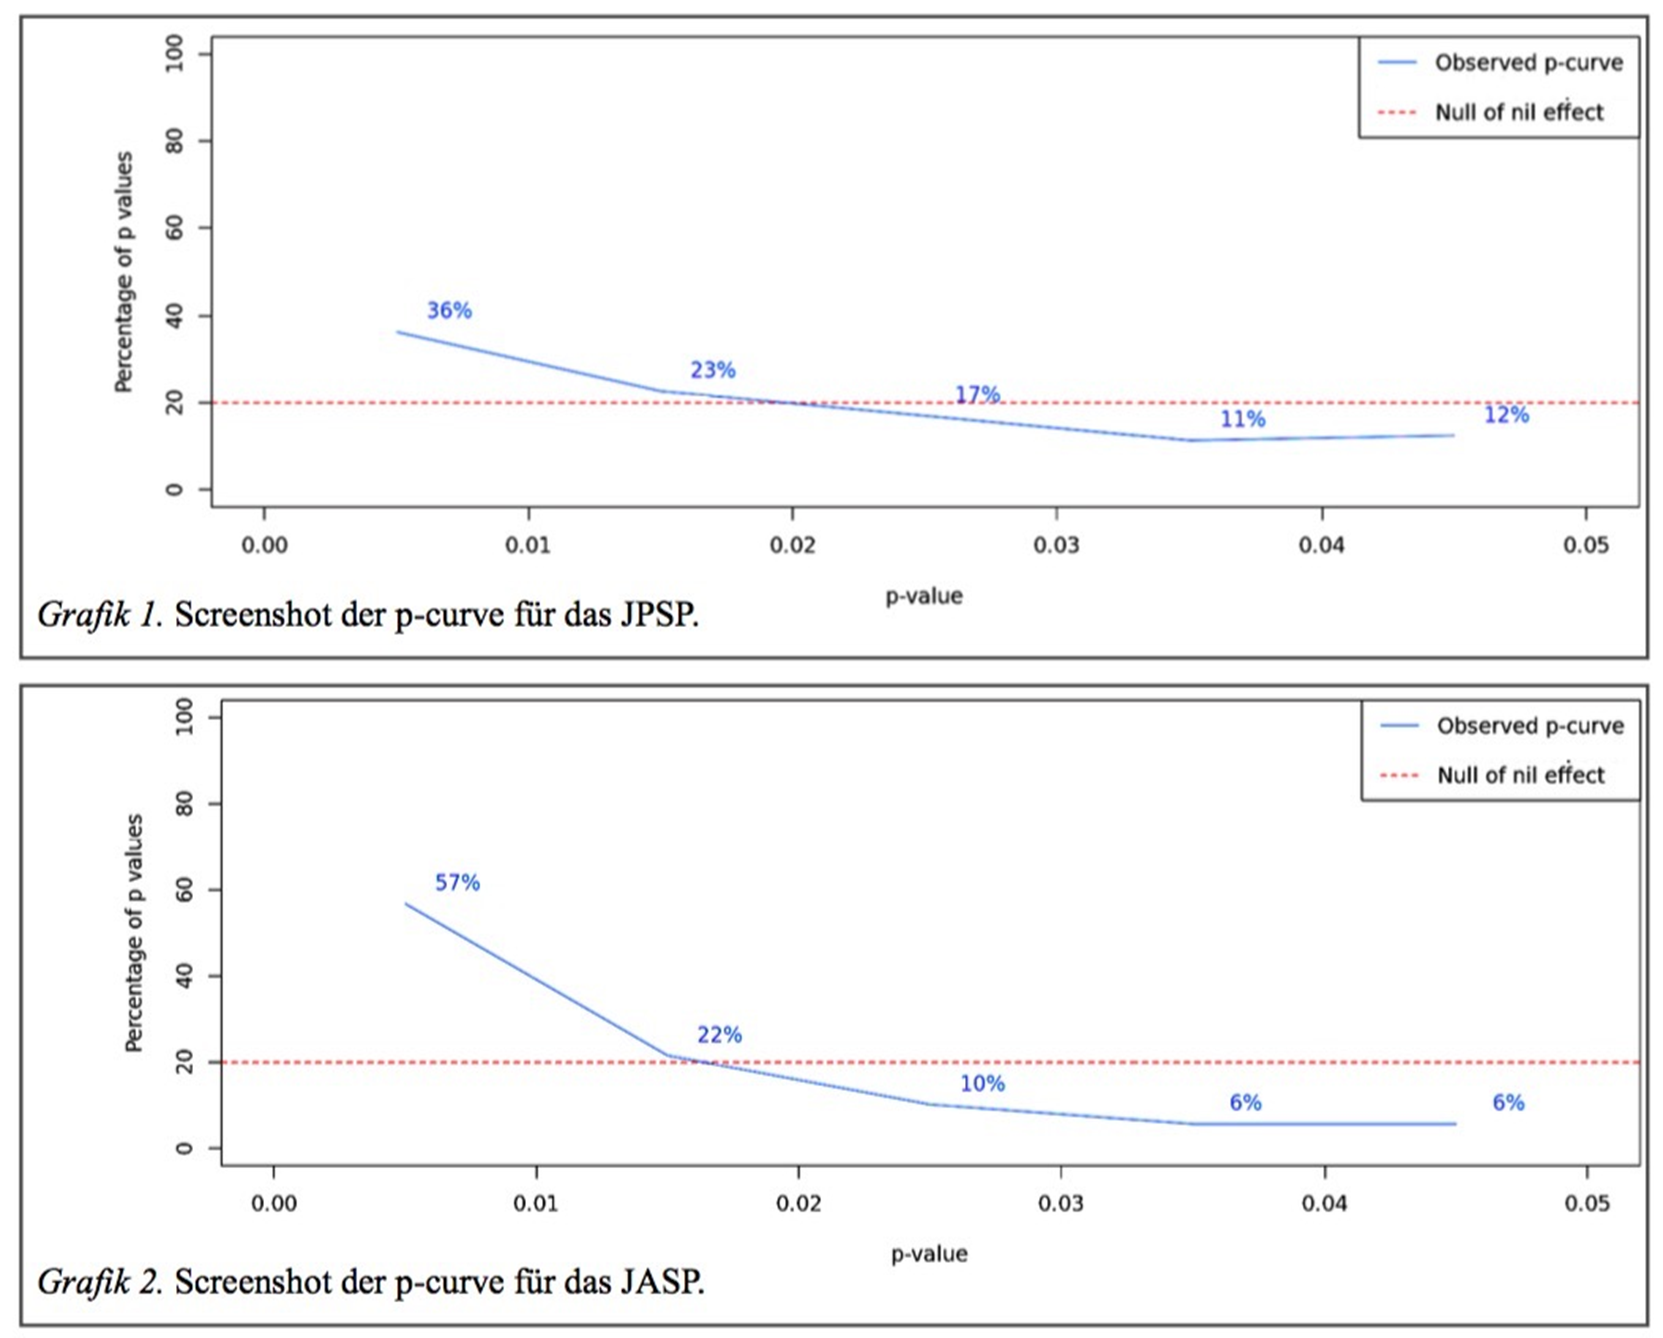
JPSP: estimated average power: 30%
JASP: estimated average power: 91%
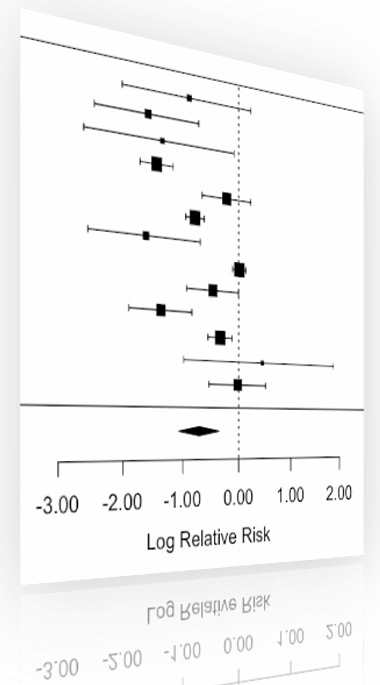
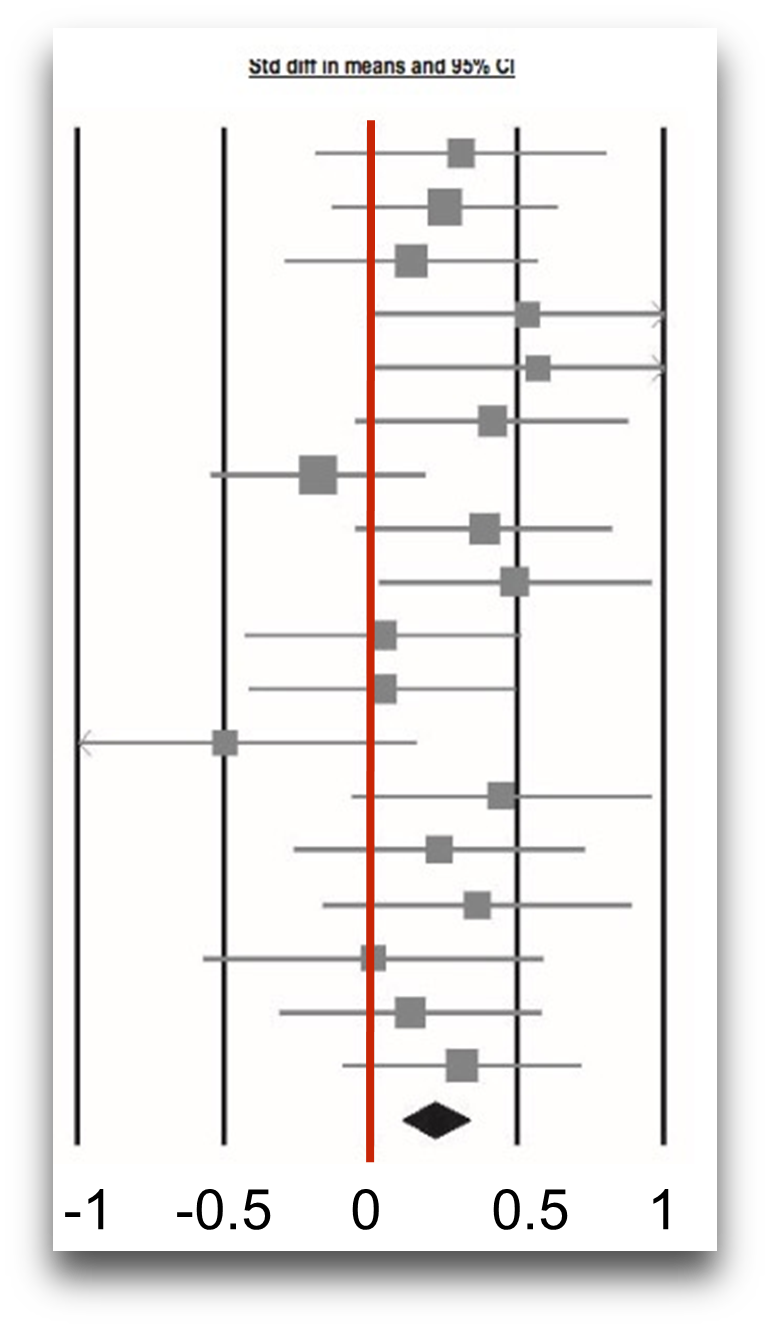
But meta-analyses reveal the truth! (Do they?)
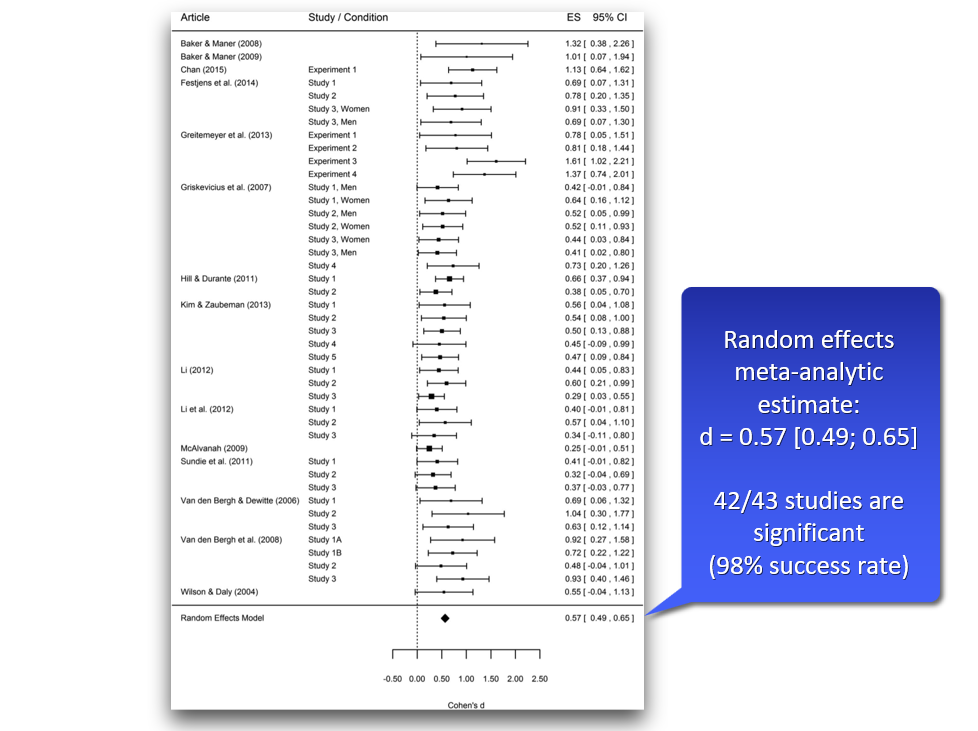
True H₁ samples:
d = 0.5
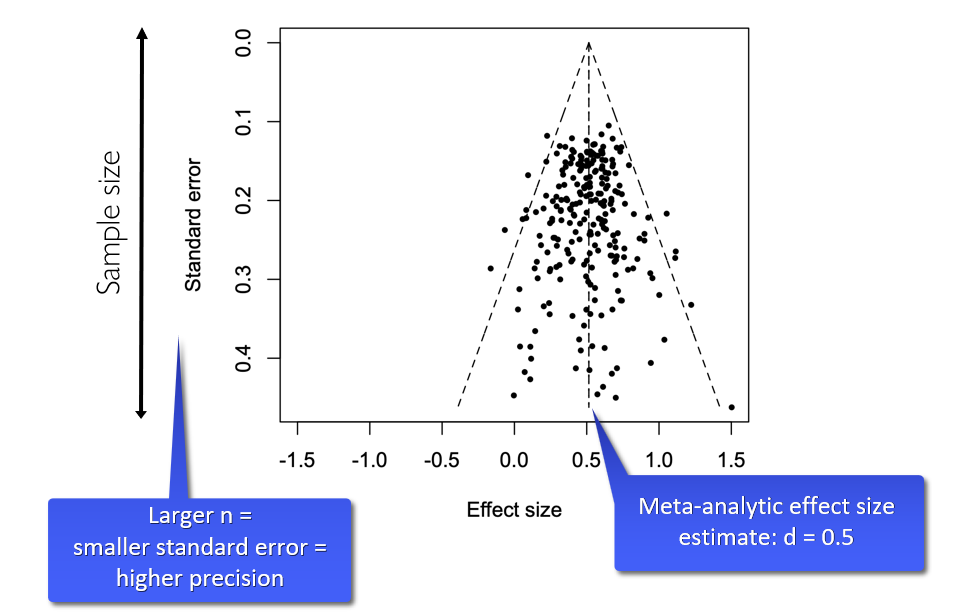
True H₁ samples:
d = 0.5
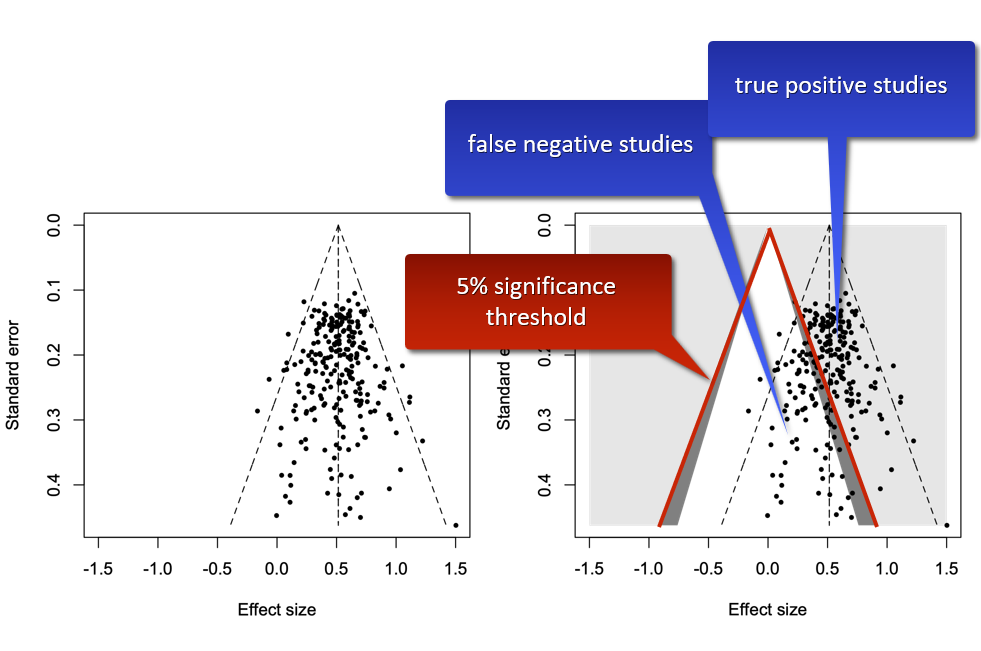
True H₀ samples
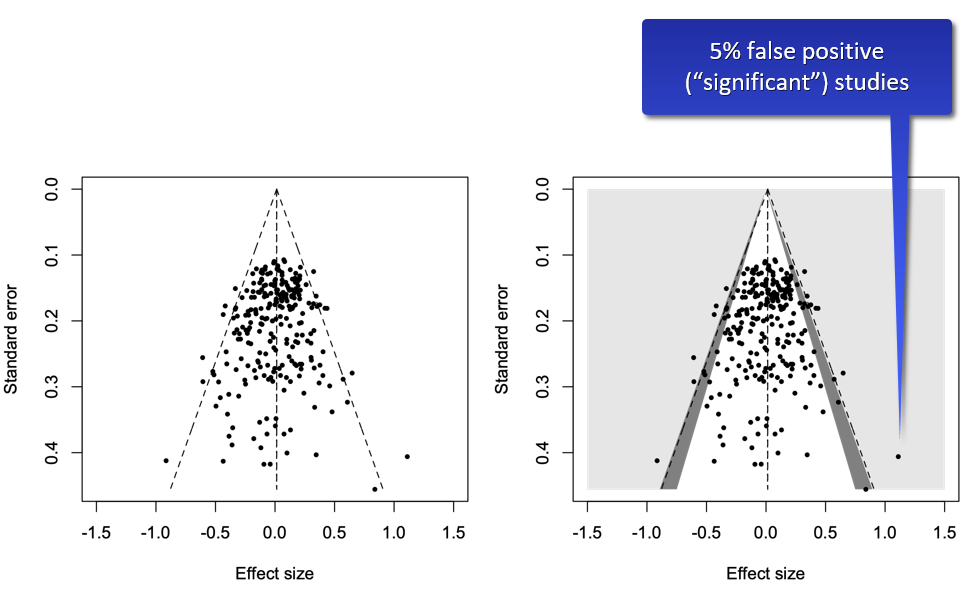
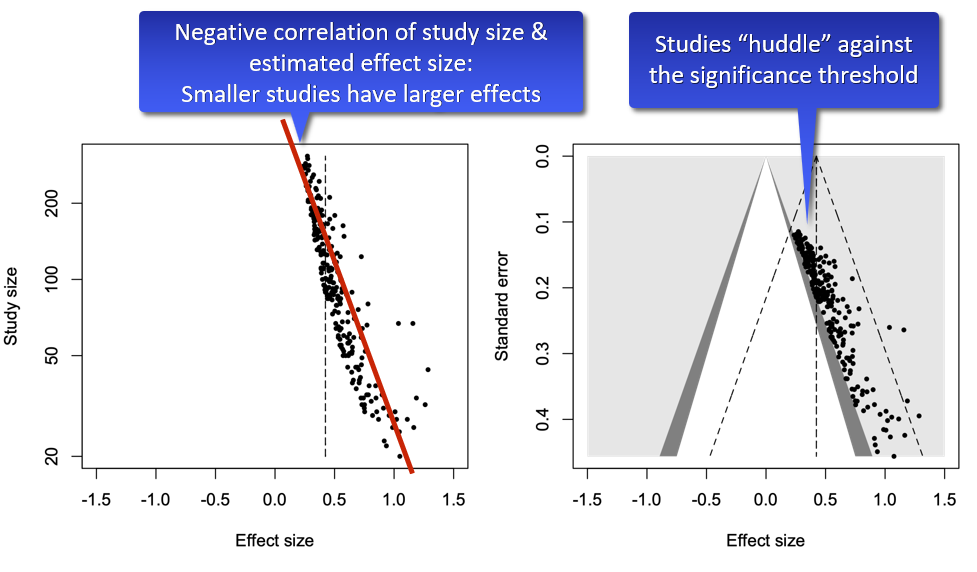
True H₀ + publication bias
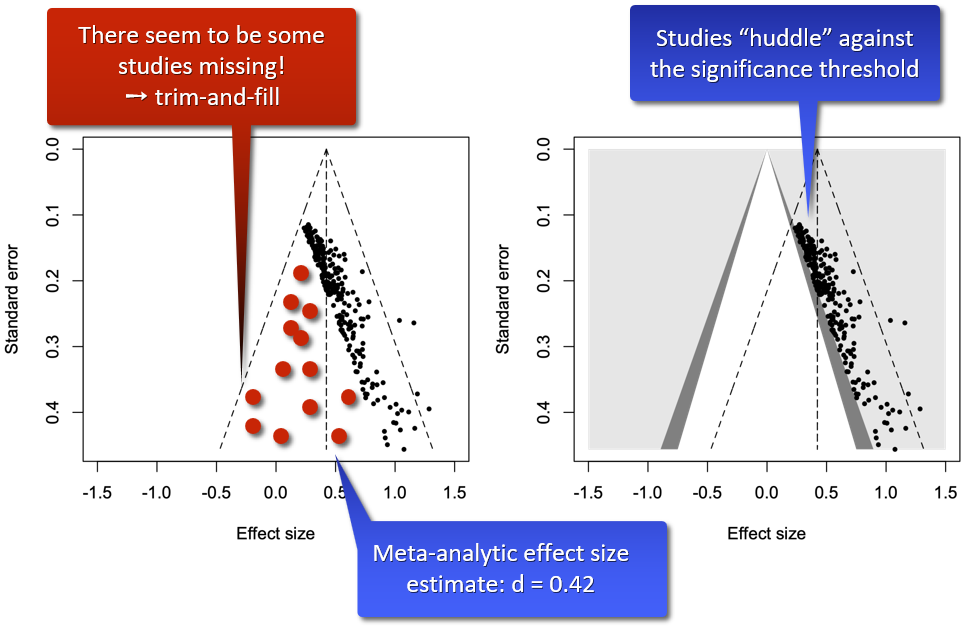
True H₀ + publication bias
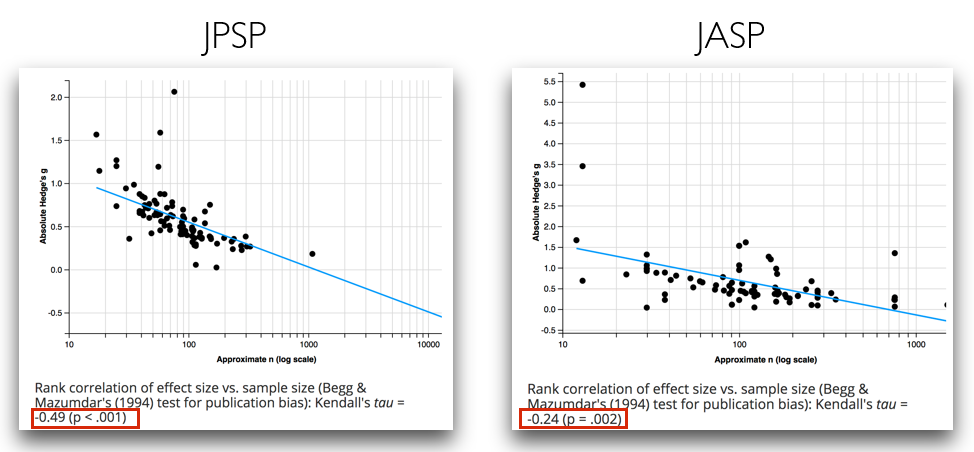
Begg & Mazumdar test
- Begg & Mazumdar’s test for publication bias:Rank correlation between effect and its precision (i.e., standard error of effect size)
- Alternatively: Rank correlation between effect size and sample size
- Significant negative correlation = sign of publication bias
- Good Type I error control (i.e., false alarms at nominal, say, 5% level)
- Low power (i.e., no significant correlation is not necessarily a good sign for no publication bias)
Begg, C. B., & Mazumdar, M. (1994). Operating characteristics of a rank correlation test for publication bias. Biometrics, 50(4), 1088. http://doi.org/10.2307/2533446
JPSP vs. JASP: R-index & TIVA

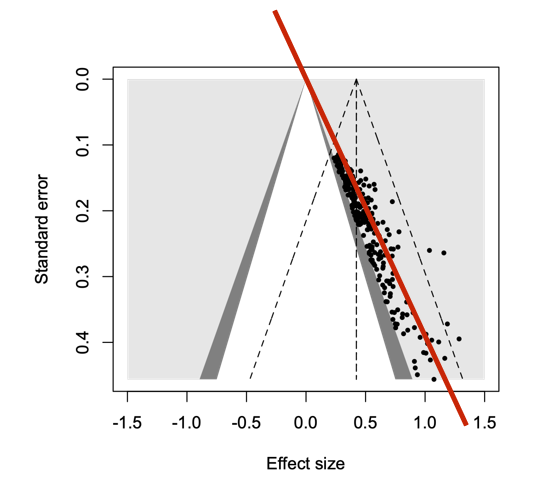
Egger’s regression test
- If slope of regression line ≠ zero (with p < .10): indication of publication bias
- Same idea like Begg & Mazumdar, but “probably more powerful” in detection of bias
Extending Egger’s test: PET
- Use Egger’s regression line, but do not focus on slope, but on the intercept!
- What is the expected ES at maximum precision (i.e., zero SE)?
- Intercept = estimate for true underlying effect correct for small-study effects
- PET = precision effect test
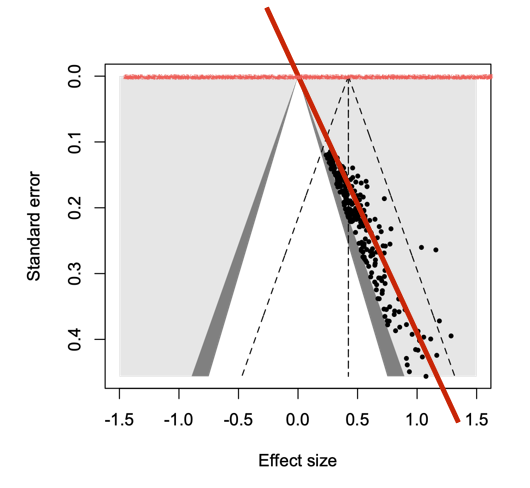
Stanley, T. D., & Doucouliagos, H. (2013). Meta-regression approximations to reduce publication selection bias. Research Synthesis Methods, 5(1), 60–78. http://doi.org/10.1002/jrsm.1095
PET-PEESE
(Stanley & Doucouliagos)
- PEESE = precision-effect estimate with standard error ➙ effect size is regressed on the variance rather than standard error
- As in PET: Intercept is interpreted as estimate of true effect
- Simulation studies show: PET underestimates if true effect is non-zero, PEESE overestimates if true effect is zero.
- ➙ Suggestion: If PET intercept is not significant with p > .05, (i.e.: corrected ES does not differ from zero), use the PET intercept as estimate. If PET intercept significantly differs from zero, use PEESE intercept as estimate.
- No real theoretical foundation - just the ad-hoc solution that worked best.
# R Code
PET = lm(d~se, weights = 1/v)
PEESE = lm(d~se^2, weights = 1/v)
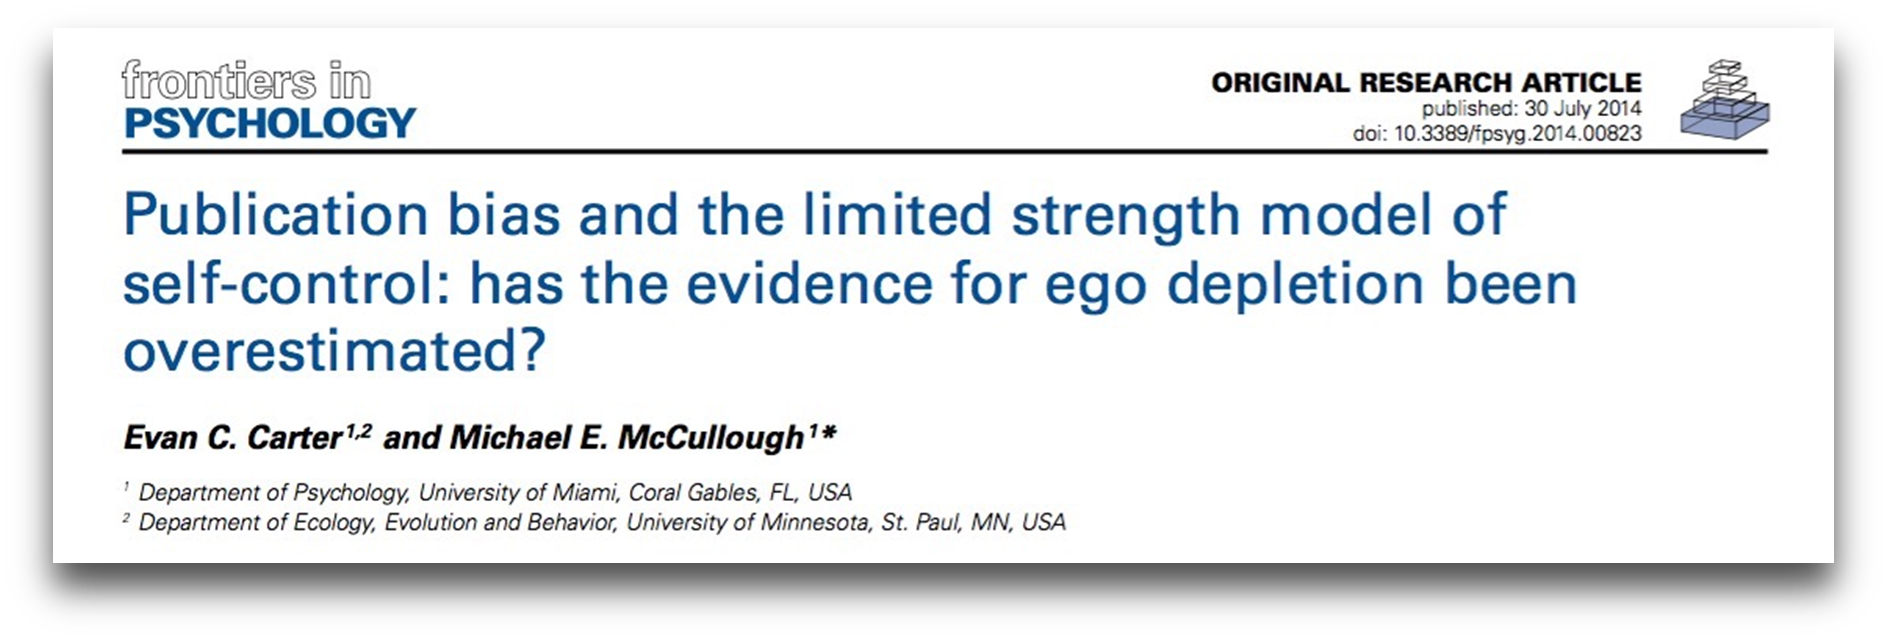
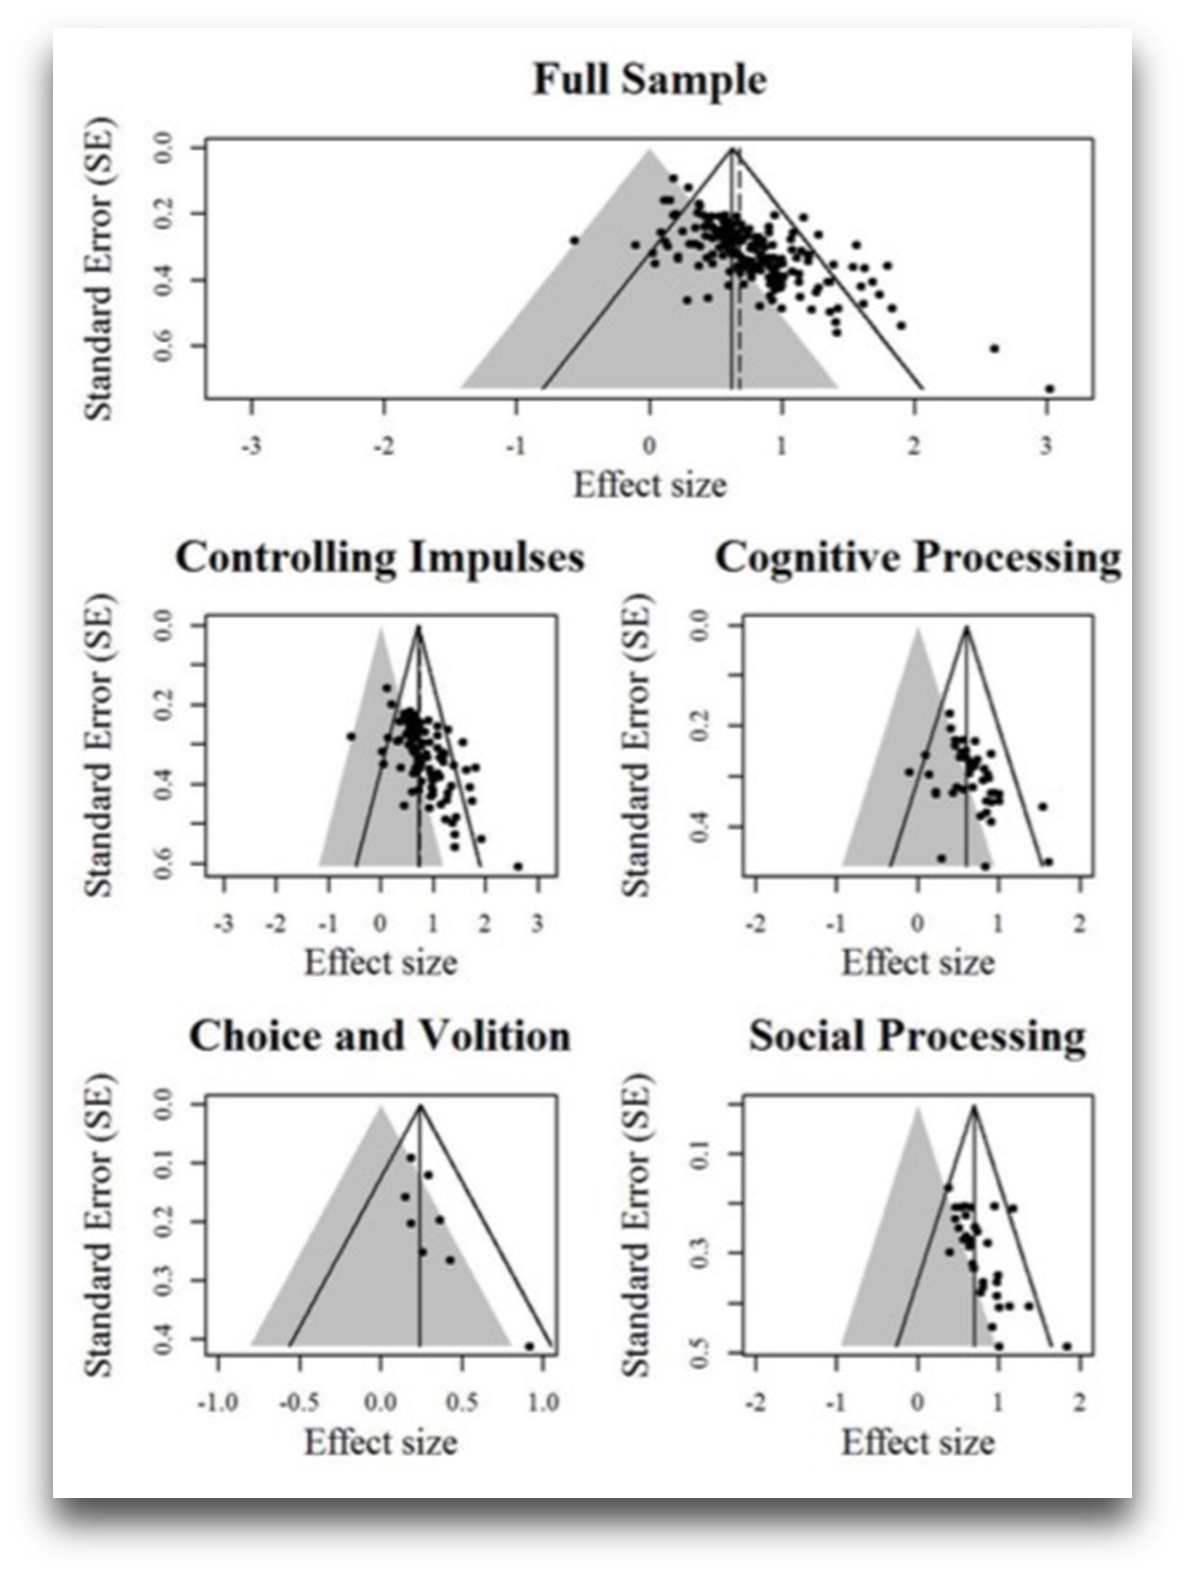
Appendix of Carter, E. C., & McCullough, M. E. (2014). Publication bias and the limited strength model of self-control: has the evidence for ego depletion been overestimated? Personality and Social Psychology, 5, 823.
Stanley, T. D., & Doucouliagos, H. (2013). Meta-regression approximations to reduce publication selection bias. Research Synthesis Methods, 5(1), 60–78. http://doi.org/10.1002/jrsm.1095
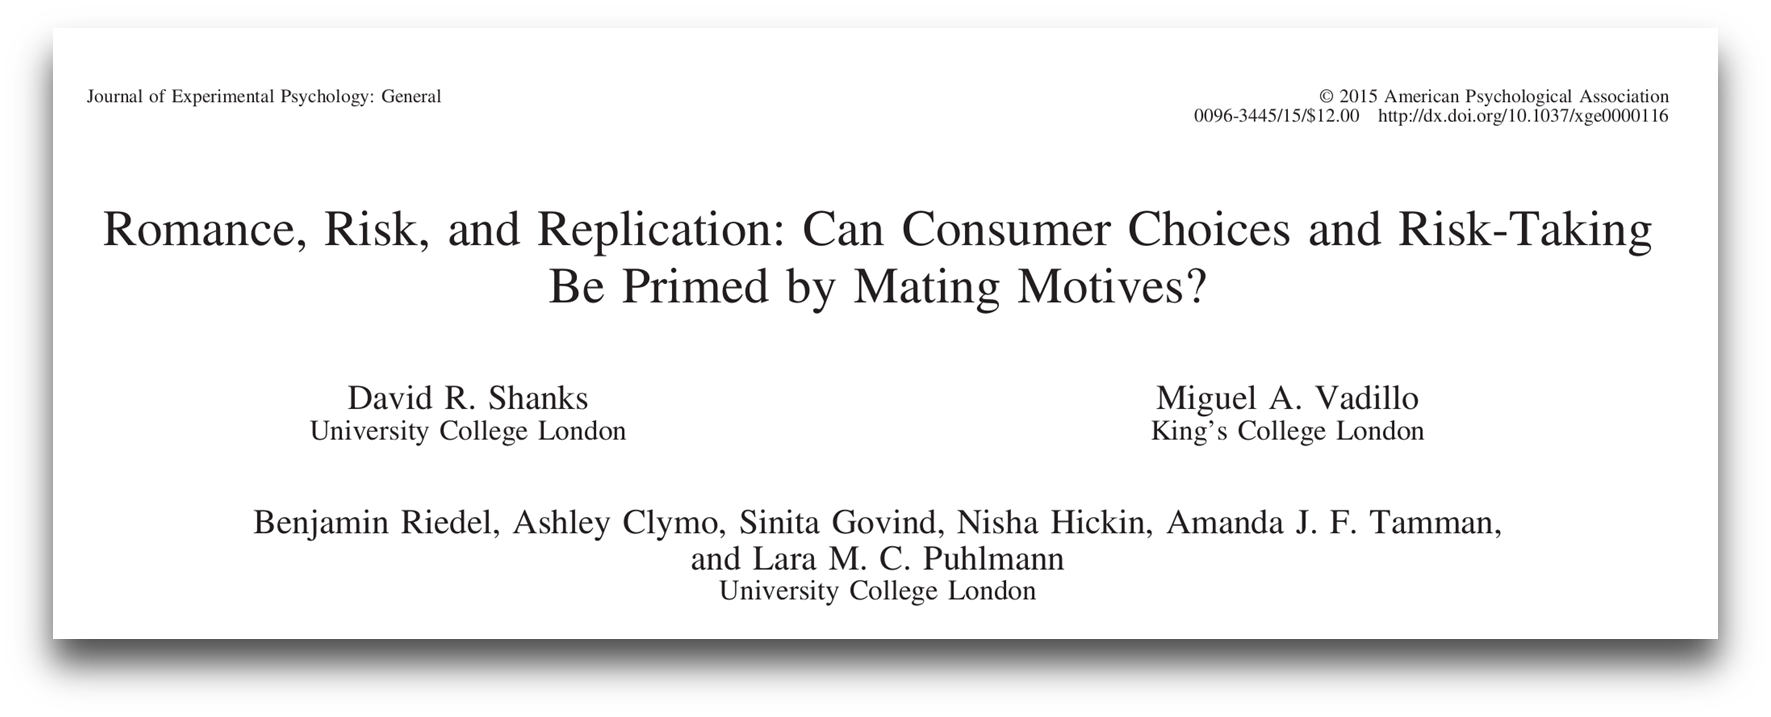
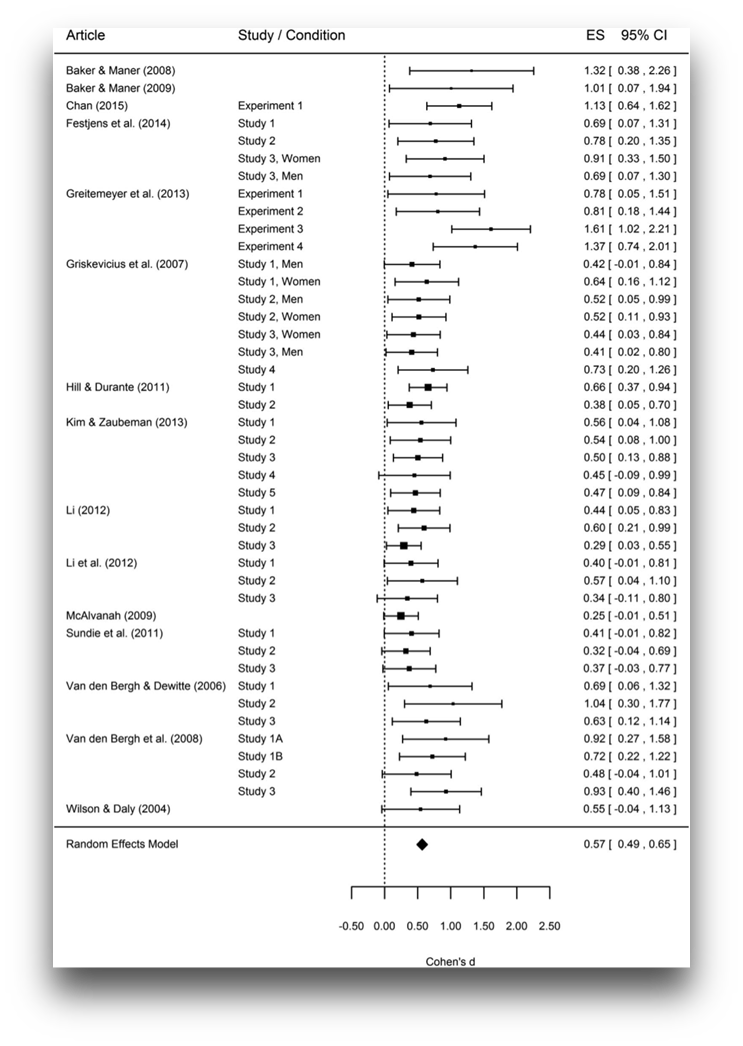
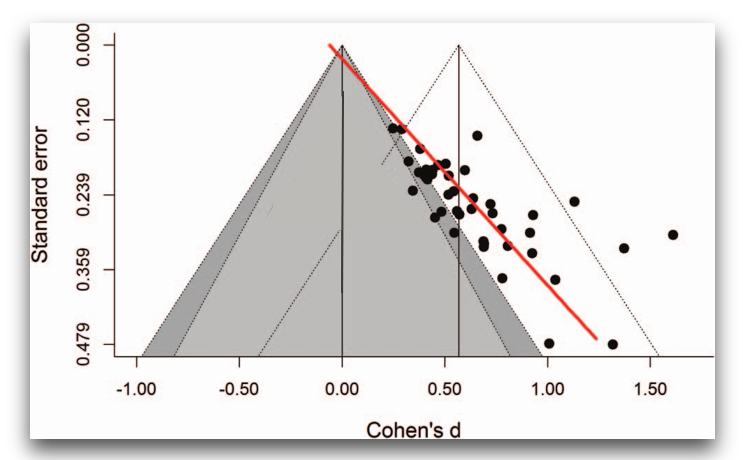
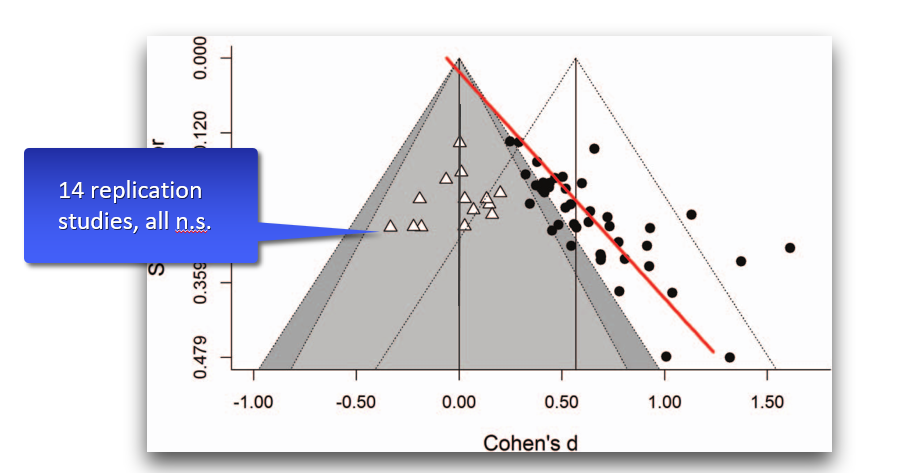
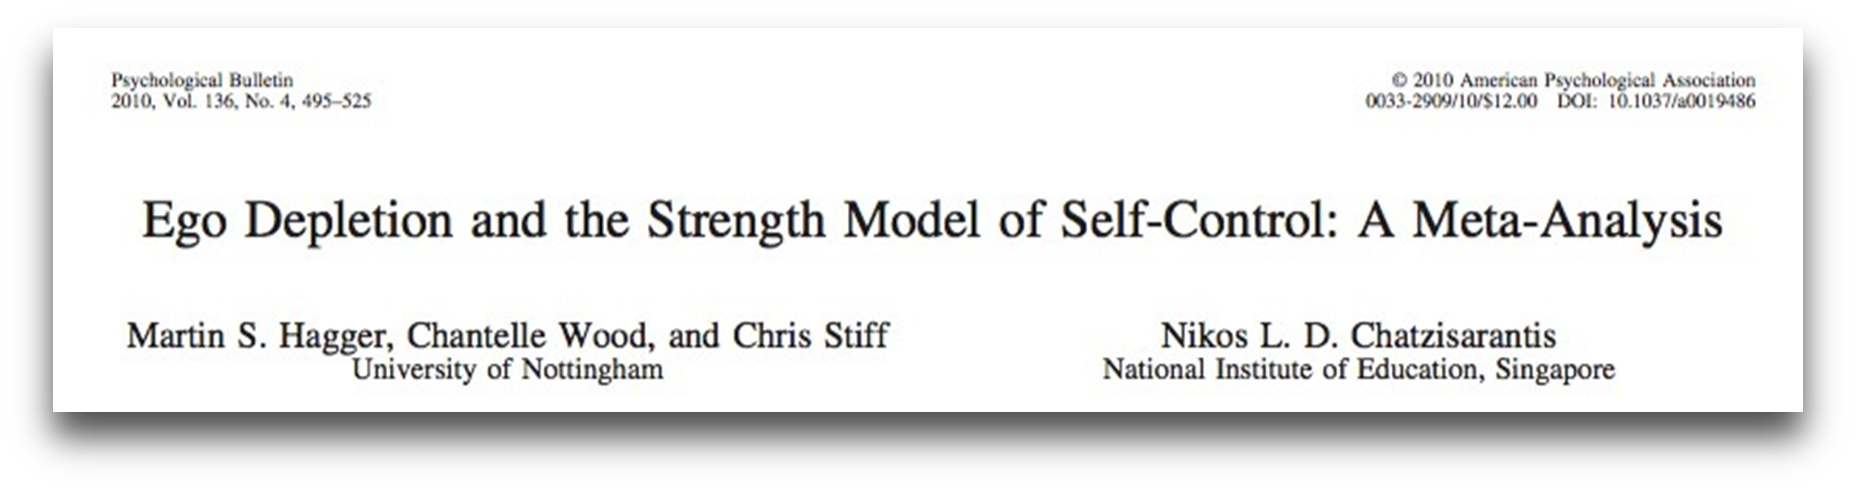
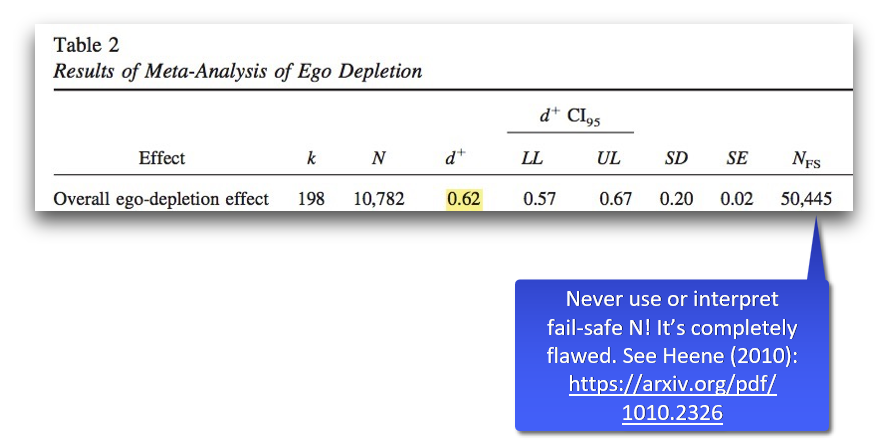
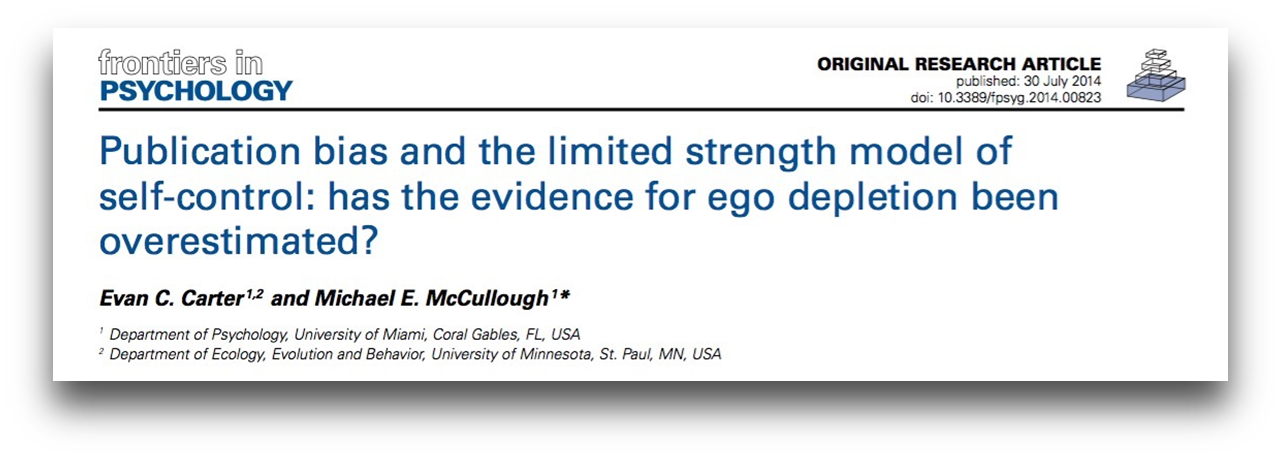
“Instead, we believe our results are best interpreted as demonstrating that the current evidence for the depletion effect is not convincing, despite the hundreds of experiments that have examined it.”
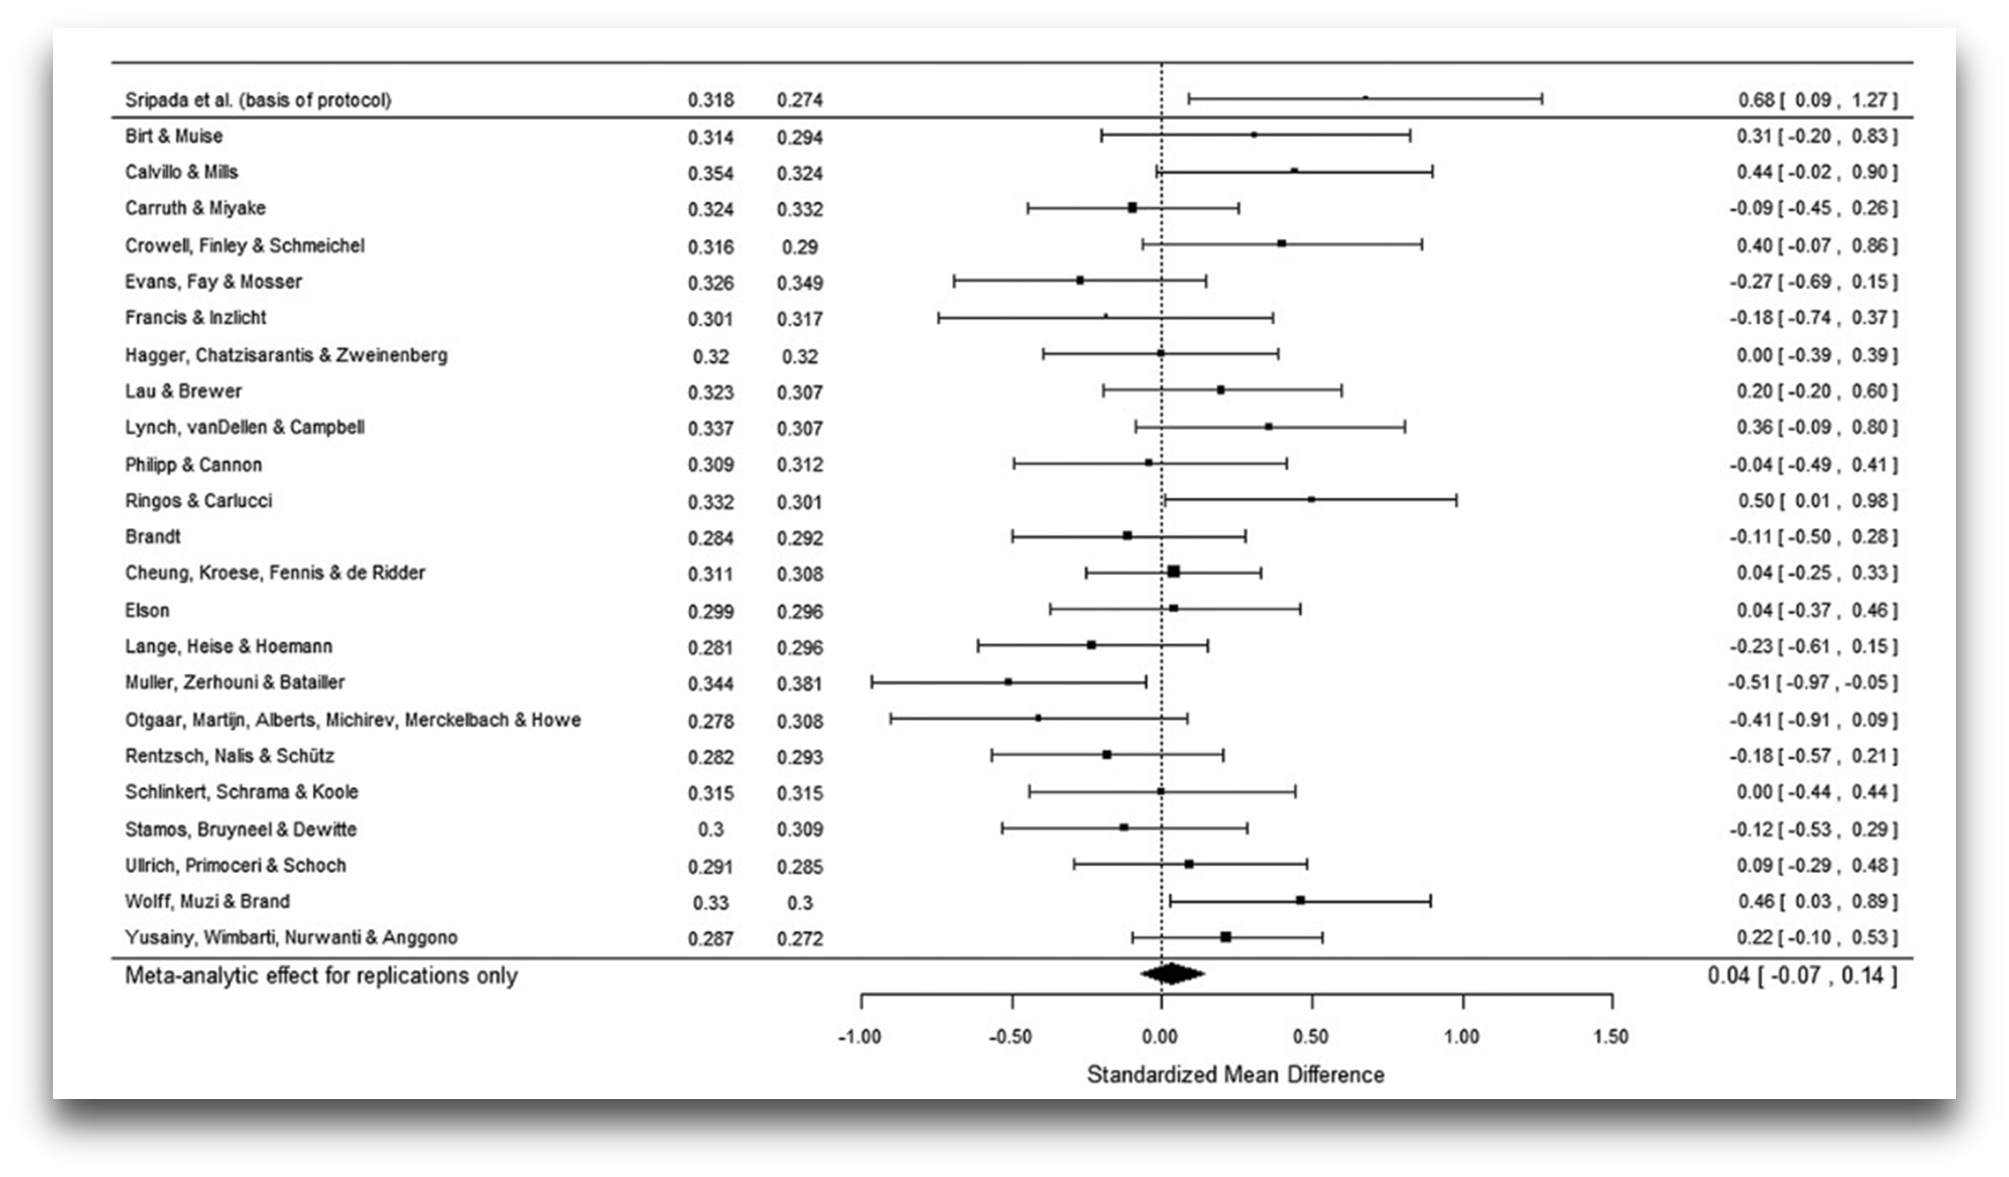
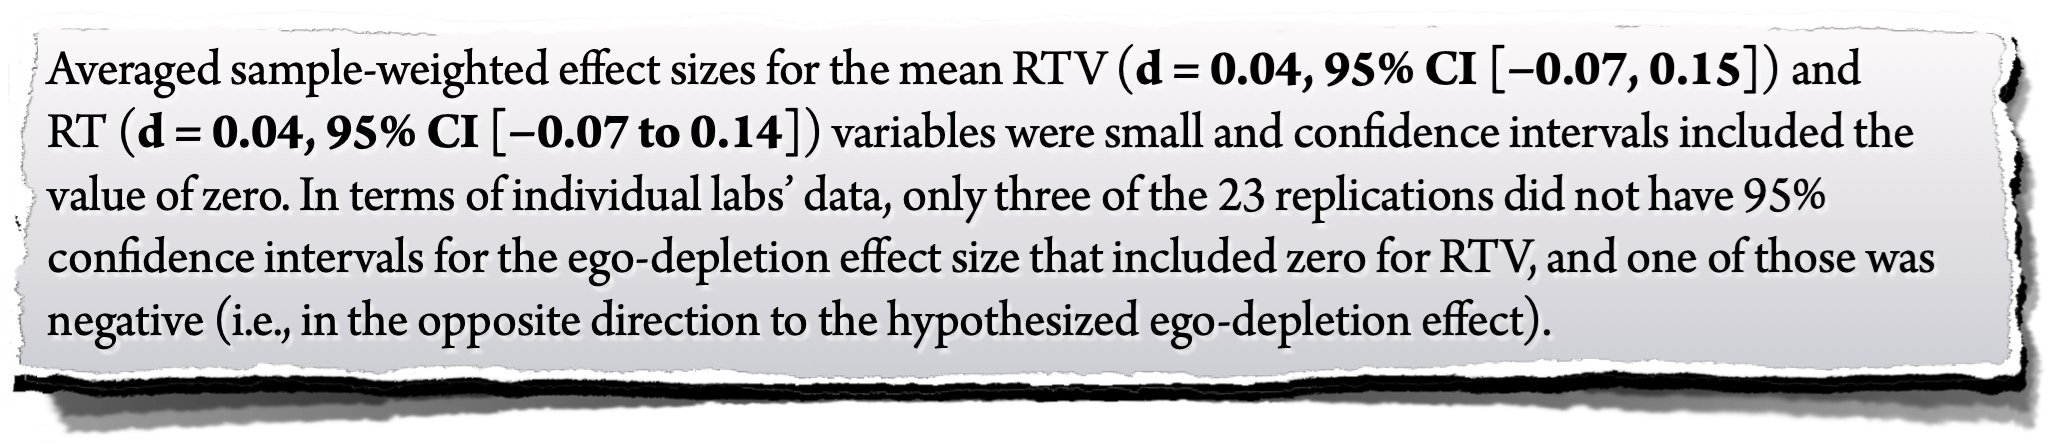
Hagger, M. S., & Chatzisarantis, N. L. D. (2016). A Multilab Preregistered Replication of the Ego-Depletion Effect. Perspectives on Psychological Science, 11(4), 546–573. http://doi.org/10.1177/1745691616652873
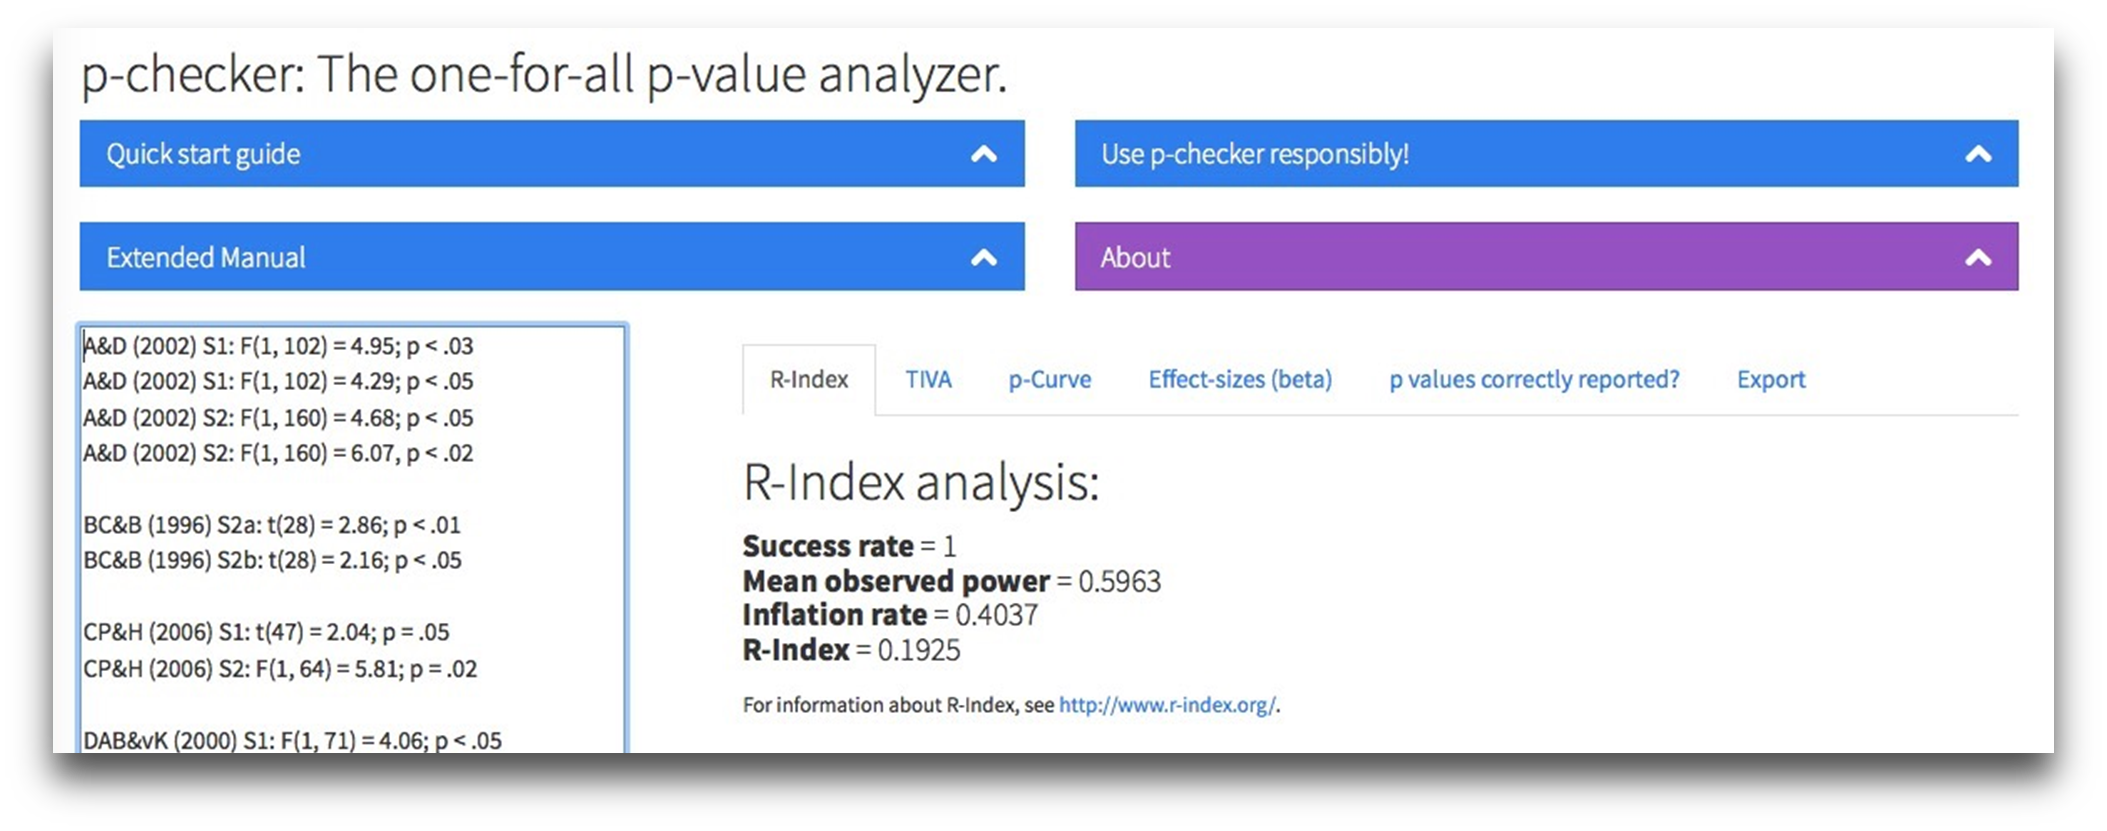
Practice with p-checker
http://shinyapps.org/apps/p-checker/
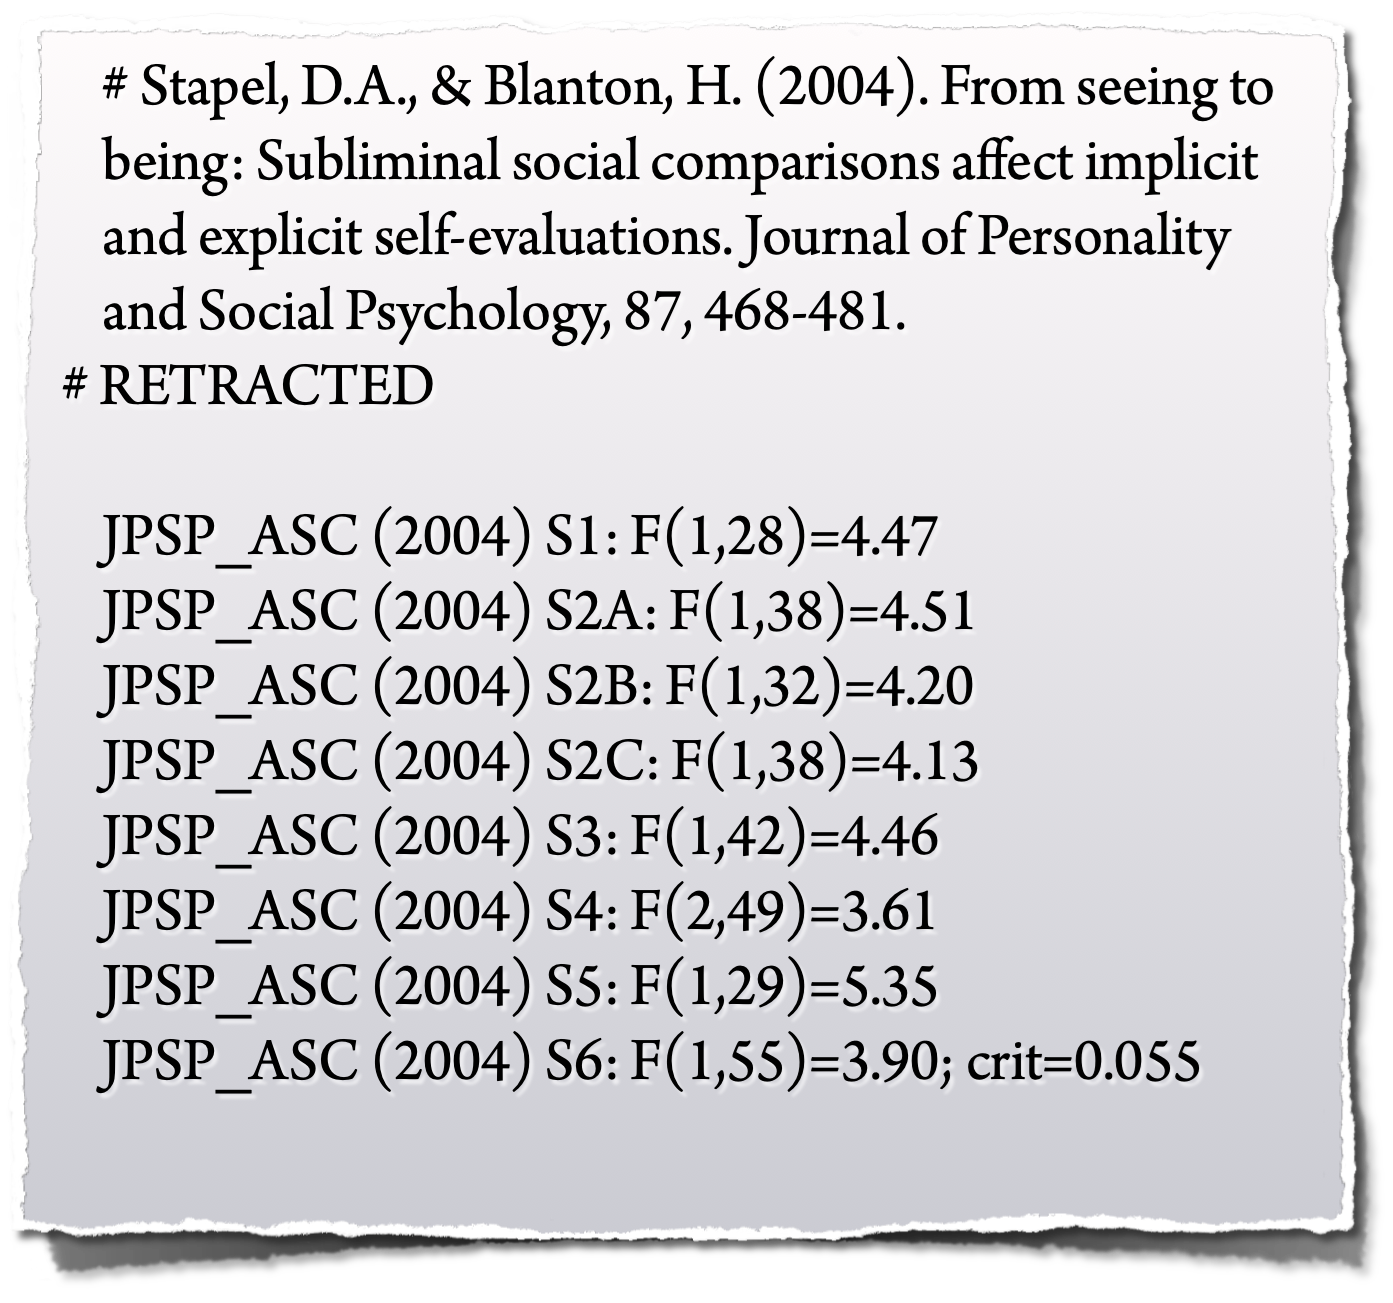
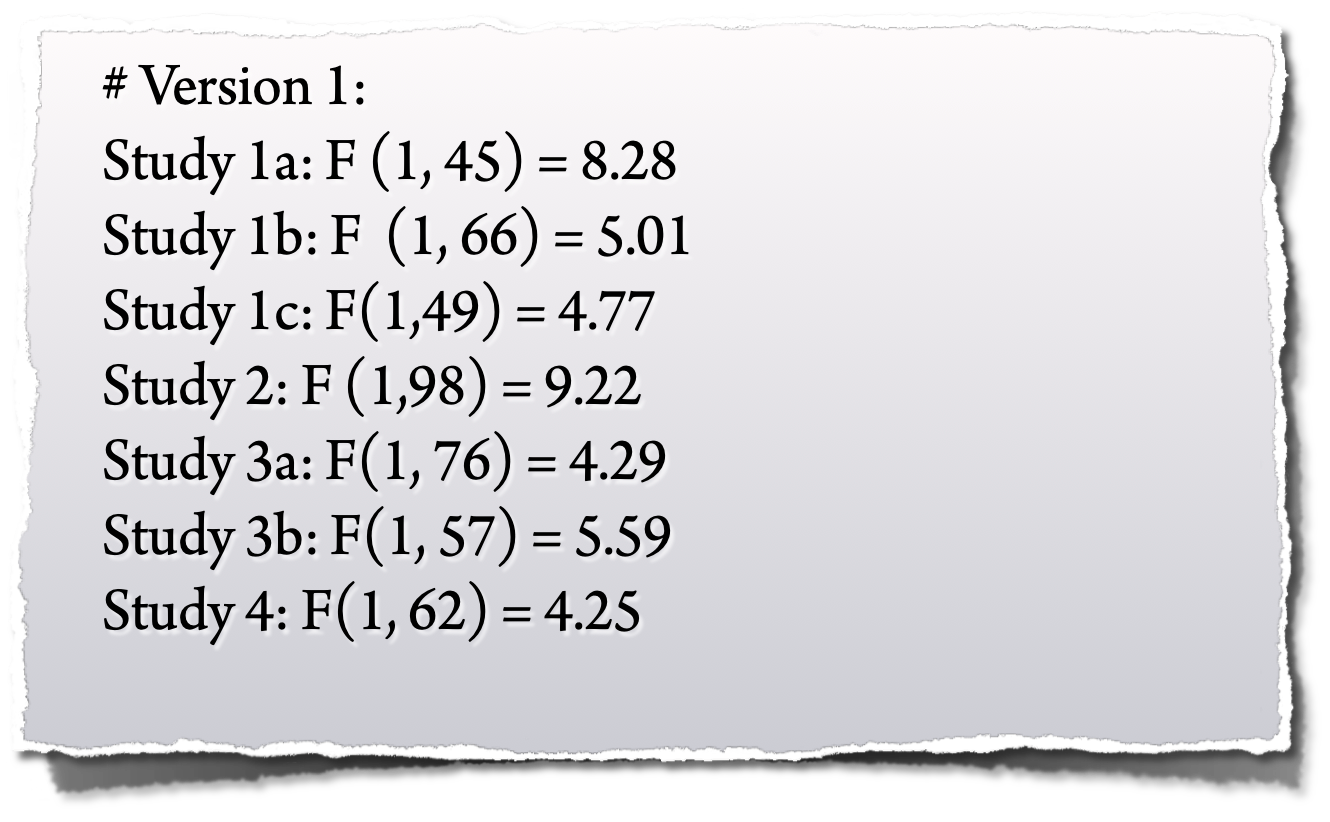
“A tale of two papers”
by Michael Inzlicht
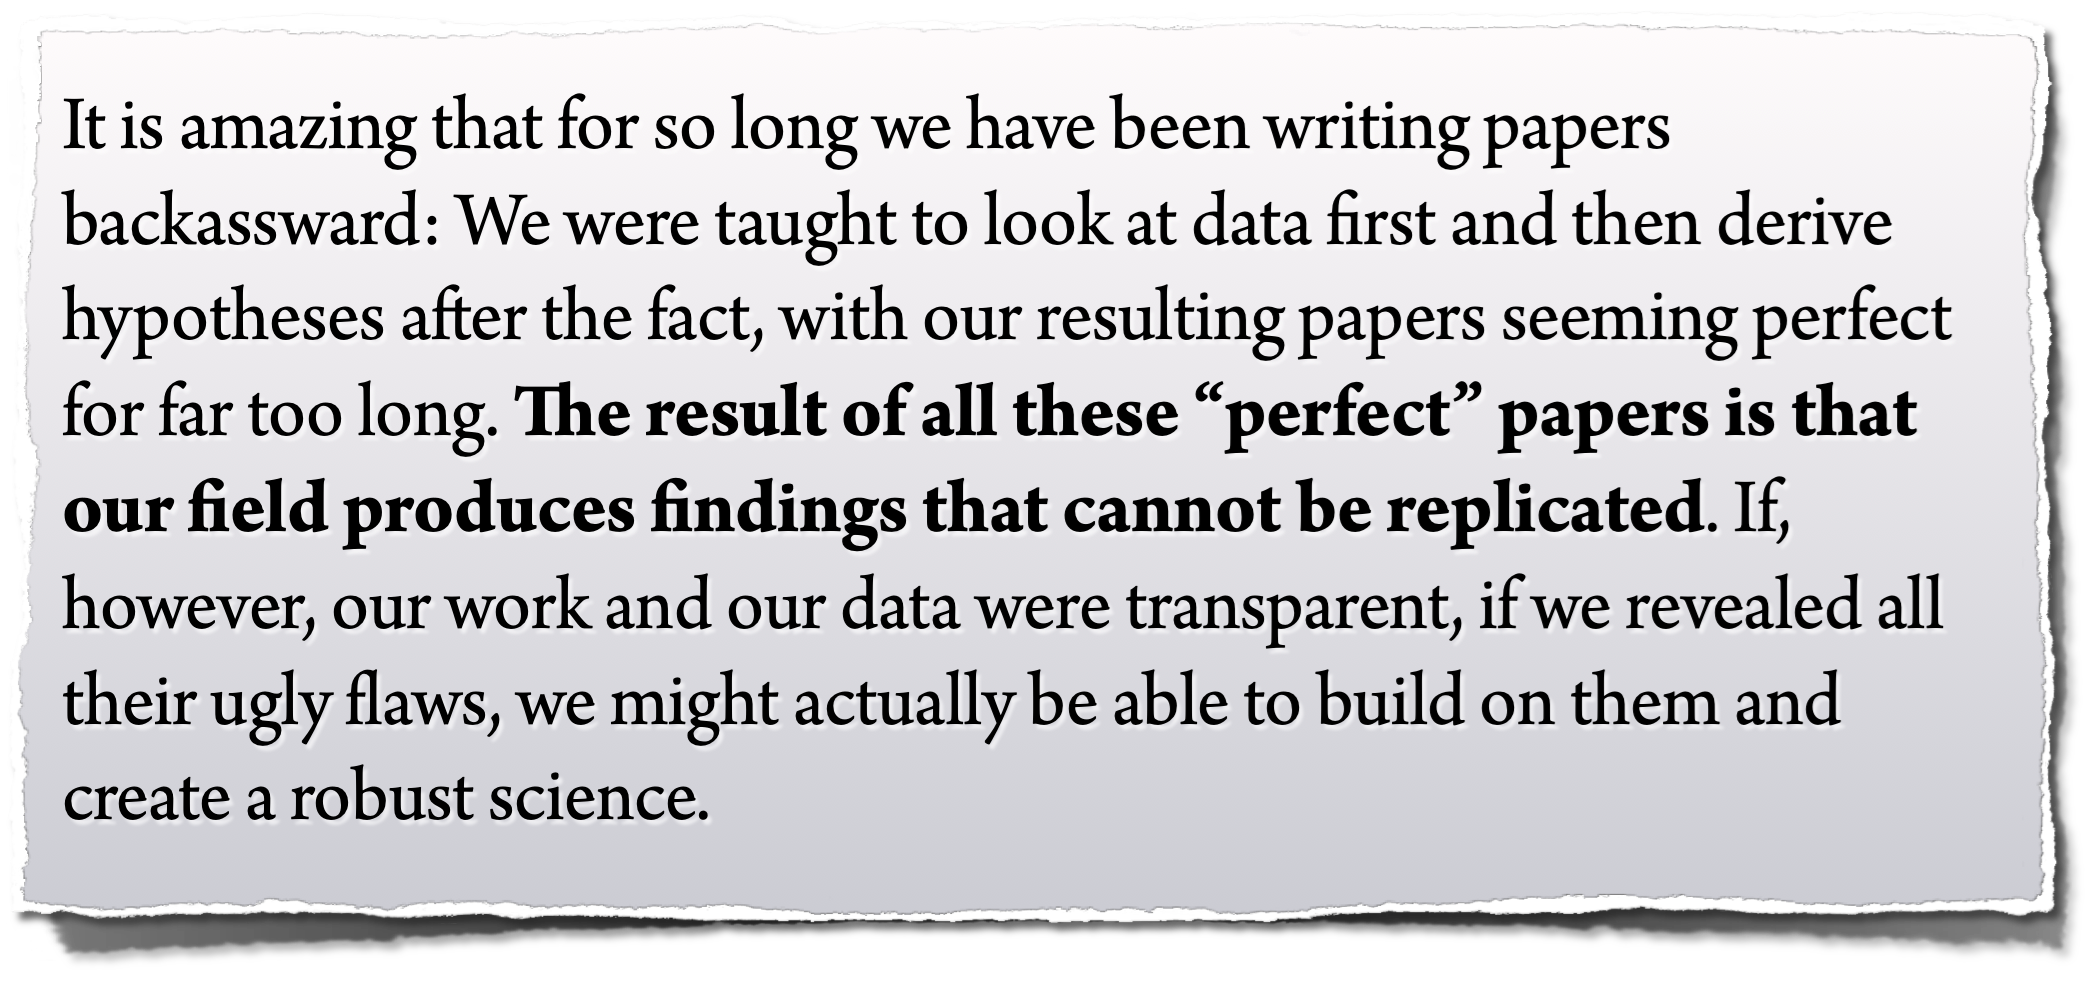
“A tale of two papers”
by Michael Inzlicht
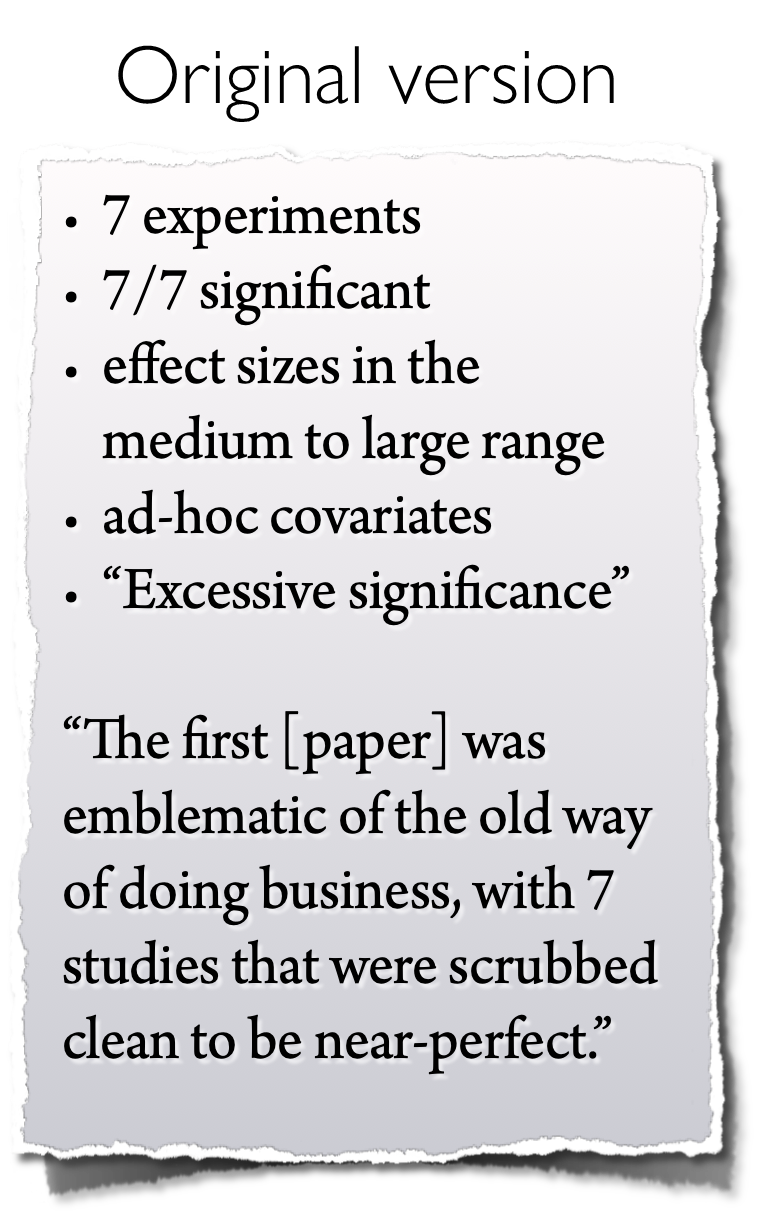
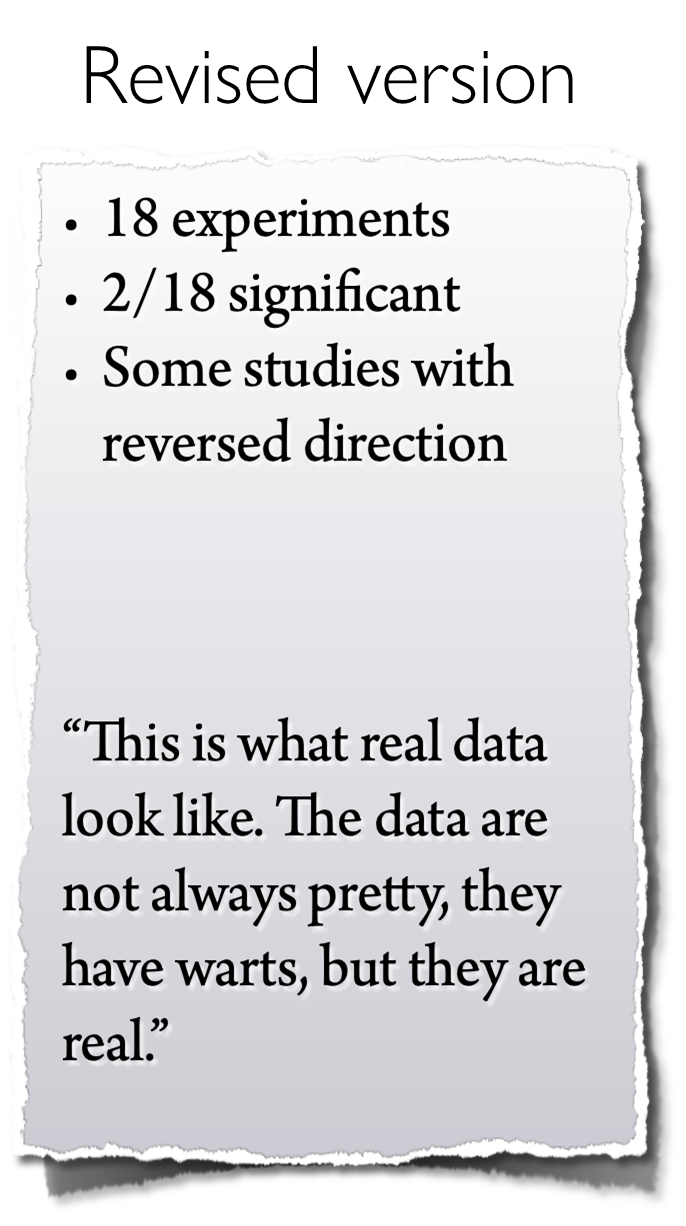
http://sometimesimwrong.typepad.com/wrong/2015/11/guest-post-a-tale-of-two-papers.html
Tuk, M. A., Zhang, K., & Sweldens, S. (2015). The Propagation of Self-Control: Self-Control in One Domain Simultaneously Improves Self-Control in Other Domains. Journal of Experimental Psychology: General, 144, 639–654. http://doi.org/10.1037/xge0000065
Informed skepticism
(“detection of Don’ts”)
- We have indicators which allow to evaluate the credibility and evidential value of a line of research
- p-curve, R-index/ excess significance, TIVA, meta-regression techniques
- None of these techniques is perfect - but look out for (converging) red flags
- Use these flags for informed skepticism (not for a “witch hunt” or “replication police”)
Red flags

- Sweeping claims, counterintuitive, and shocking results
- Most p values are in the range of .03 – .05
- p-curve is not right-skewed
- TIVA: Smaller variance of p-values than expected
- A highly cited result, but no direct replications have been published so far
- Too good to be true
- R-index < 40% / “Excess significance”
- Biased meta-analysis: Asymmetric funnel plot
(Possibly) Invalid flags

- Impact factor of journal
- The author’s h-index
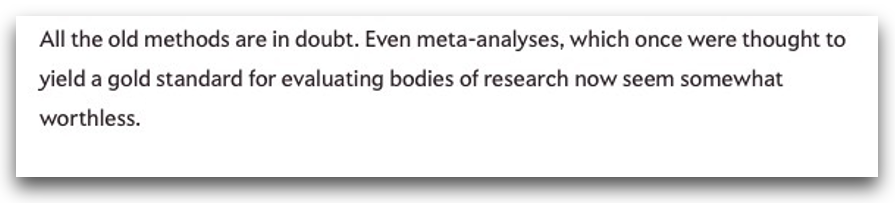
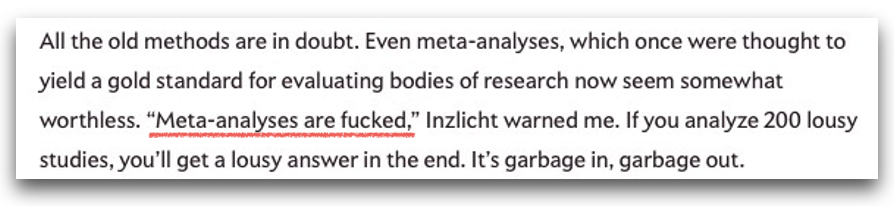
- Meta-analyses
- Garbage-in, garbage-out: Meta-analyses of a biased literature produce biased results.
- Typical correction methods do not work well. Jury is still out for new developments such as PET-PEESE.
- When looking at meta-analyses, at least one has to check whether and how it was corrected for publication bias. Trim-&-Fill does not work well.
Green flags

- Pre-registration
- High Power
- Larger samples, within-designs
- Independent high-power replications
- Open Data and Open Material
- Willingness to share research data is related to the strength of the evidence and the quality of reporting of statistical results (Wicherts, Bakker, & Molenaar, 2011)
- Quarterly Journal of Political Science: 54% of papers “had results in the paper that differed from those generated by the author’s own code” ➙ a well prepared data set and analysis code should be a validity indicator
- Using the “21 Word Solution” of Simmons, Nelson, & Simonsohn (2012)